Message Boards Message Boards

The Scoville scale of peppers (151st birth anniversary of W.L. Scoville)

Today is the 151st birth anniversary of Wilbur Lincoln Scoville, who is best known for his Scoville Organoleptic Test that is used to measure hotness of peppers. Born in Bridgeport Connecticut on January 22nd, 1865, Wilbur Lincoln Scoville was a chemist, award-winning researcher, professor of pharmacology and the second vice-chairman of the American Pharmaceutical Association.
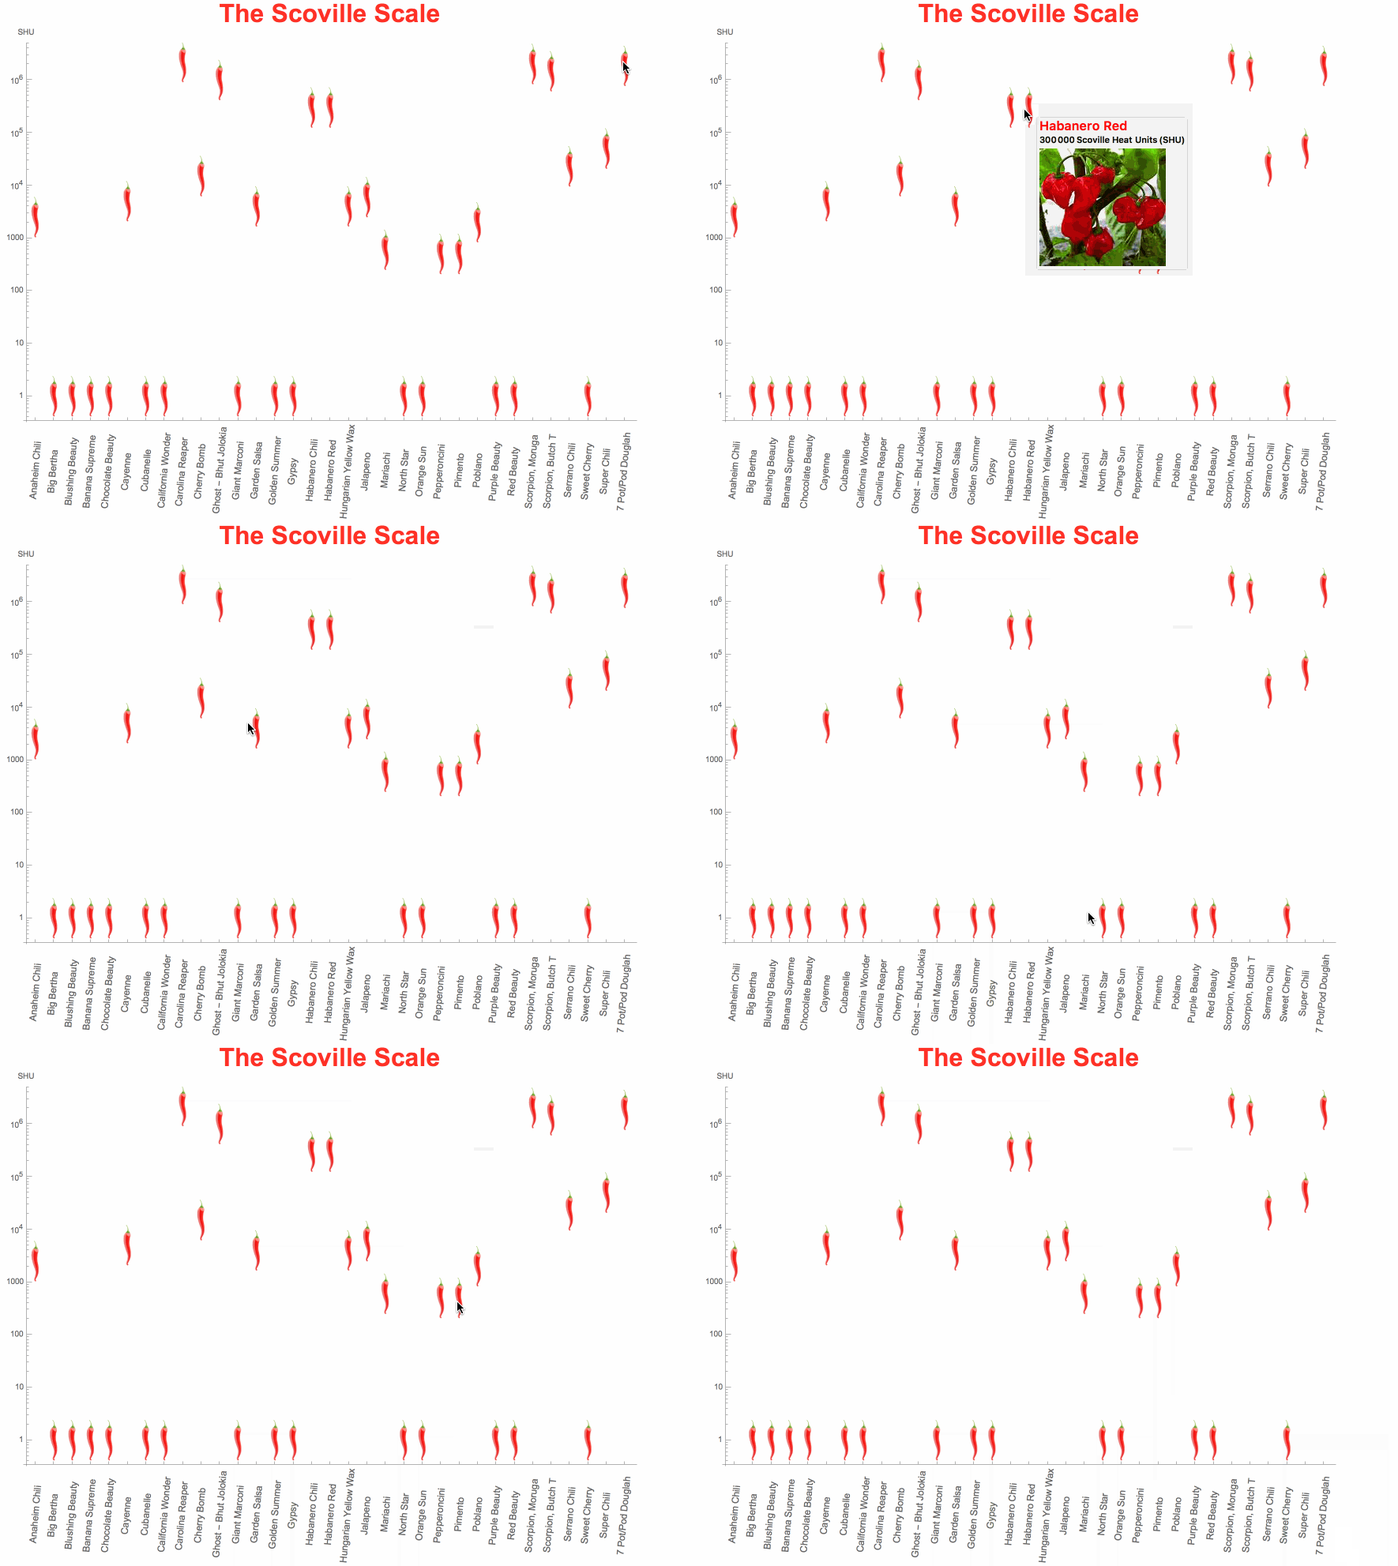
enter image description here

First, I generated a dataset of peppers from an excel file available at Meadow view growers website, the images were obtained using BingSearch which connect to the Bing Search API with the Wolfram Language.

bs = ServiceConnect["BingSearch"];
ServiceExecute["BingSearch","Search",{"Query"->" pepper","SearchType"->"Images","MaxItems"->1,"Elements"->"Thumbnails"}]
pepper

peppers = 
 Dataset[<|"variety" -> First[#], 
     "image" -> 
      ImageResize[First@ServiceExecute["BingSearch", 
        "Search", {"Query" -> First[#] <> " pepper", 
         "SearchType" -> "Images", "MaxItems" -> 3, 
         "Elements" -> "Thumbnails"}],100], 
     "days" -> 
      Quantity[
       If[StringQ[Part[#, 2]], Last@StringSplit[Part[#, 2], "-"], 
        Part[#, 2]], "days"], "type" -> Part[#, 3], 
     "scoville" -> 
      Interpreter["Integer"][Last@Quiet@StringSplit[Part[#, 4], "-"]],
      "comments" -> Last[#]|> & /@ 
   Import["http://www.meadowview.com/wp-content/uploads/2012/08/\
PepperChart.xls"][[1, 3 ;; 35]]]
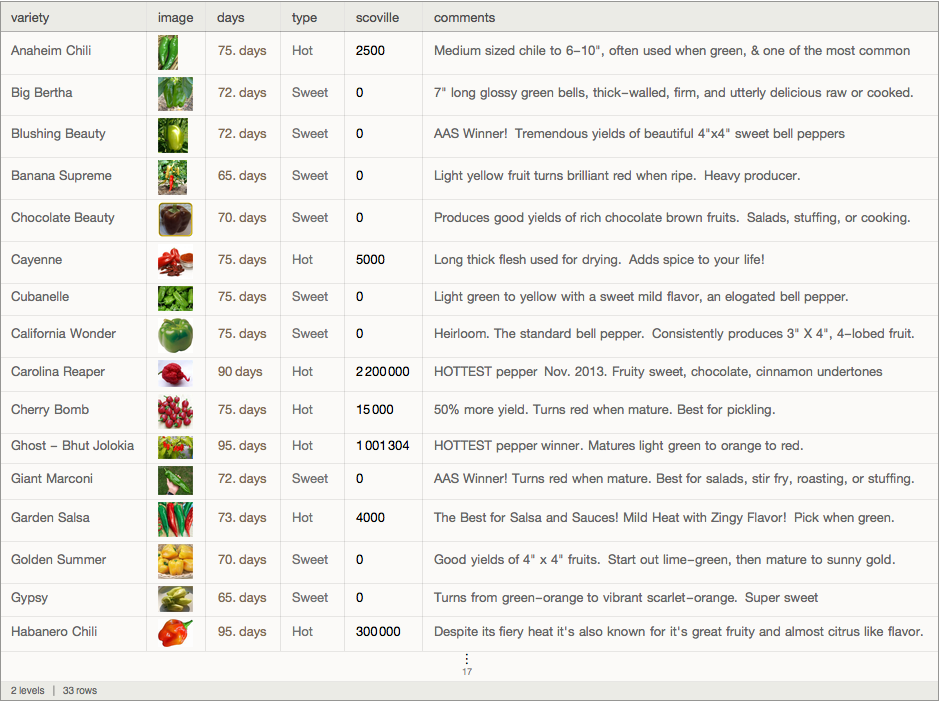
enter image description here

Finally, I visualize the Scoville scale of the peppers using a ListLogPlot:

ListLogPlot[
 MapThread[
  Tooltip[# + 1, TableForm[#2]] &, {Normal[peppers[All, "scoville"]], 
   MapThread[{Style[#1, Bold, 16, Red], 
      Style[#2 "Scoville Heat Units (SHU)", Bold], #3} &, {Normal[
      peppers[All, "variety"]], Normal[peppers[All, "scoville"]], 
     Normal[peppers[All, "image"]]}]}], ImageSize -> 800, 
 PlotRange -> All, AxesLabel -> {None, "SHU"}, PlotMarkers -> Style["j", 34, Red, Bold], 
 PlotRange -> All, 
 PlotLabel -> 
  Style["The Scoville Scale", 32, RGBColor[1, 0.05, 0, 0.85], Bold], 
 Ticks -> {MapThread[{#1, 
      Rotate[Style[#2 , FontSize -> 12], 85 Degree]} &, {Range[33], 
     Normal[peppers[All, "variety"]]}], Automatic}]

Check out the notebook attached and the dataset peppers.m in order to explore the interactive visualization.

Attachments:
8 Replies

Nice interactive ListLogPlot! Thanks for sharing it, Jofre.

I found it interesting that pepper varieties that take longer to mature tend to score higher SHU values:

ListLogPlot[
 Table[Normal[GroupBy[peppers, "type"][i][All, Tooltip[{#days, 1 + #scoville}, #variety] &]], {i, 3}], 
 PlotRange -> All, 
 AxesLabel -> {Style["Days to Mature", 12, Bold], Style["Scoville heat units
    (SHU)", 12, Red, Bold]}, 
 PlotMarkers -> {Red, Darker@Green, Orange}, 
 PlotLegends -> {"Hot", "Sweet", "Mild"}, ImageSize -> 500]

DaysVSSHU

Another observation made is that the hot type of peppers are predominantly reddish:

Table[Labeled[ImageCollage[Normal[GroupBy[peppers, "type"][i][All, "image"]]], {"Hot", "Sweet", "Mild"}[[i]]], {i, 3}]

types

Table[{"Hot", "Sweet", "Mild"}[[i]] -> 
  Part[DominantColors[
    ImageCollage[RemoveAlphaChannel[#, Transparent] & /@ RemoveBackground /@ Normal[GroupBy[peppers, "type"][i][All, "image"]]], 3], 2 ;; 3], {i, 3}]

Dominant Colors

And sweet peppers are best suited for salads as their WordCloud of comments indicates:

Table[Labeled[
  WordCloud[
   DeleteStopwords@StringJoin[Riffle[Normal[GroupBy[peppers, "type"][i][All, "comments"]], " "]]], {"Hot", "Sweet", "Mild"}[[i]]], {i, 3}]

Word Cloud

POSTED BY: Bernat Espigulé

This is extremely beautiful and appetizing :) . However, the animation does not work for me. I have downloaded both the notebook and the m file in the same directory, run the notebook, but there is no animation, only a static pic of the pepper chart. see the attached screen shot. Am I overlooking something very trivial? Another question, very outsider-ish - do you have a version which can be shared on community pages? I have lots of friends who love hot chili peppers, but do not use Mathematica (probably do not have even a cdf reader). Thanks!!

POSTED BY: Imre Pazsit

@Imre Pázsit have you checked if Tooltip works when the mouse hovers over one of these pepper icons? This is not an animation but tooltips should work in Mathematica or CDF player. Unfortunately CloudCDF does NOT support images on tooltips yet. So the CDF player is still needed.

POSTED BY: Bernat Espigulé

Thanks for your comment! Yes the tooltip works, when I put the cursor over the pepper icons, I got a pic of the corresponding sort. But in the original message (at the top of this conversation) the cursor moves by itself. If I copy the link of this conversation to a web browser, it still works the same way (by the way this is how I shared it on Facebook). And for this to work, one does not even need to have cdf player or Mathematica, I checked in on such computers. So the code behind how the "self-going" animation above must be different from the notebook that Jofre shared. This is the point that I do not understand.

POSTED BY: Imre Pazsit

Oh, thank you for clarifying it and sharing this post. These GIF animations are screen captures made with LICEcap.

POSTED BY: Bernat Espigulé

I see. Bernat, it is me who thanks - it was most useful! Not only for understanding it, but also for the tip on the LICEcap screen capture. So far I only used QuickTime for dynamic screen capture, but it does not make GIF animations that are suitable for inclusion in html files. I downloaded and tested LICEcap, and could reconstruct the animation. I really appreciate your help!

POSTED BY: Imre Pazsit

Cool post, thank you for sharing! If any of you want some entertaining videos about actually eating some of the hotter peppers, you need to check out these episodes of Good Mythical Morning (ordered by ascending Scoville heat of the peppers involved):

The Spicy Pepper Challenge

The Ghost Pepper Challenge

The Carolina Reaper Challenge

POSTED BY: Bianca Eifert

Check out this Instant Knockout review and the dataset peppers.m in order to explore the interactive visualization.

Attachments: ScovilleScale.nb peppers.m

I know it's a little late - and I'm not sure if you'll read this comment - but thanks so much for posting this! I'm a chili enthusiast myself so this is especially interesting to me! Can't wait to give it a try.

Reply to this discussion
Community posts can be styled and formatted using the Markdown syntax.
Reply Preview
Attachments
Remove
or Discard

Group Abstract Group Abstract