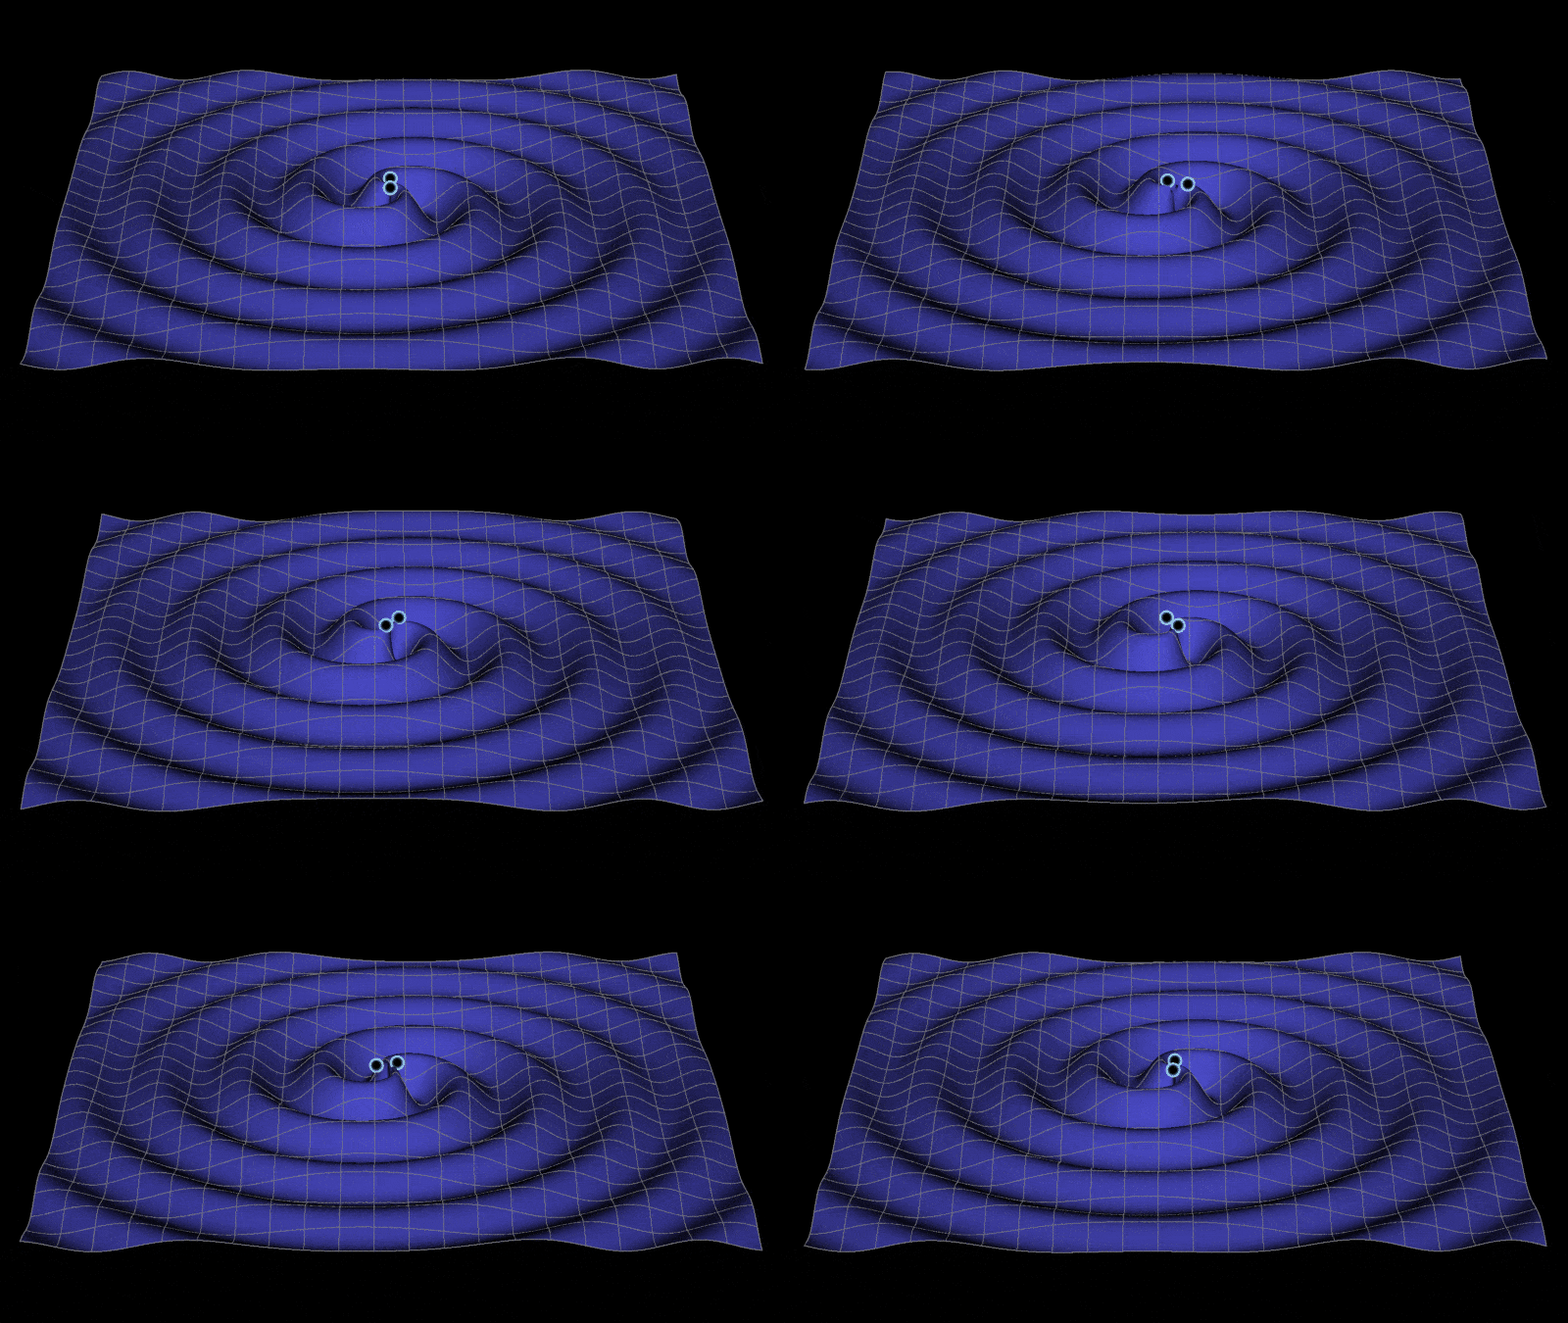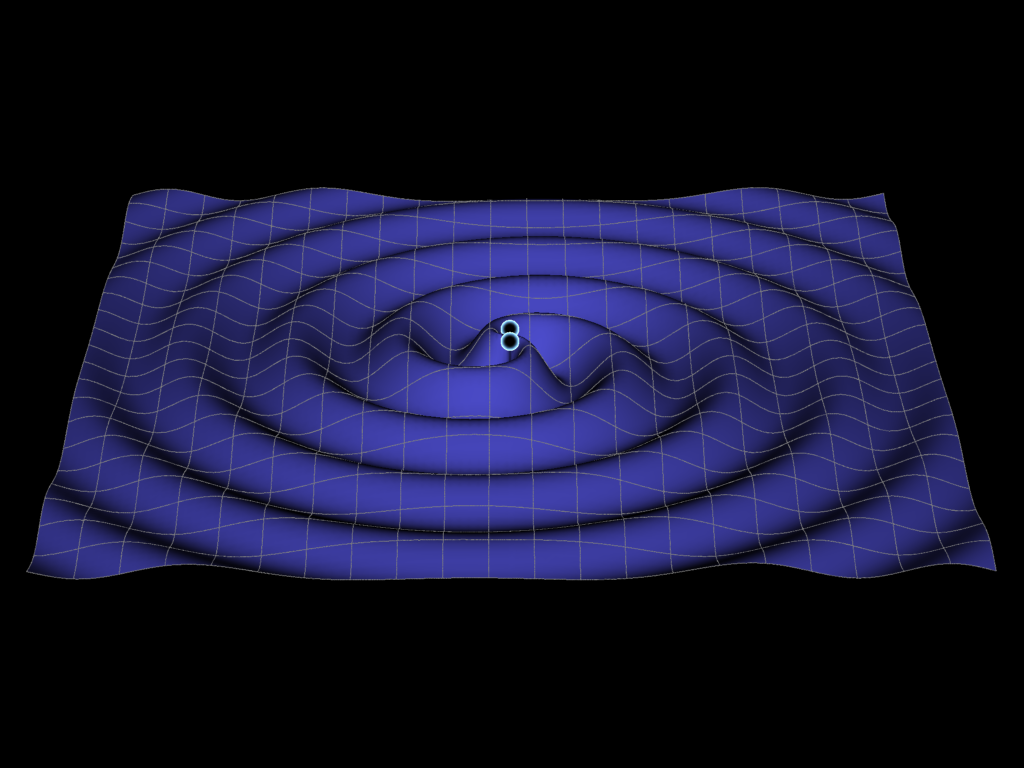
With all of the rumors and excitement about the gravity wave press release tomorrow, I was reminded of this code I've had lying around for years for creating a gravity wave visualization (seen above) for illustrative purposes. You can find also a video here. It was inspired by an interaction I had years ago (unfortunately I can't find the interaction in my email) with someone on the LISA project wanting to use Mathematica to re-create a visualization they had. This code was the result of that interaction.
First, the primary goal was to generate a "space-time" surface and mesh that had a double-armed spiral wave on it. The following code generates that. Its dependent on a rotation angle Theta which is not specified here:
Plot3D[(60 Cos[
   2 ArcTan[y/(x + 0.00001)] - \[Theta] + 0.544331 Sqrt[x^2 + y^2]])/(
 20 + Sqrt[x^2 + y^2]), {x, -45, 45}, {y, -45, 45}, PlotPoints -> 100,
  Mesh -> 20, MeshStyle -> {RGBColor[.5, .5, .5, .5]}, Boxed -> False,
  BoxRatios -> Automatic, Axes -> False,
 PlotStyle -> {RGBColor[.3, .3, .8]}, ImageSize -> {1024, 768},
 Lighting -> {{"Directional", White, ImageScaled[{0, 0, 2.}]}},
 ViewPoint -> {-0.011, -3.043, 1.479}, Background -> Black,
 BoundaryStyle -> RGBColor[.5, .5, .5, .5]]
I wanted to overlay 2 stars or black holes on top of the surface. Combining the above with this overlay and giving a value to the angle Theta we get:
With[{\[Theta] = 0},
 Show[Plot3D[(
   60 Cos[2 ArcTan[y/(x + 0.00001)] - \[Theta] +
      0.544331 Sqrt[x^2 + y^2]])/(
   20 + Sqrt[x^2 + y^2]), {x, -45, 45}, {y, -45, 45},
   PlotPoints -> 100, Mesh -> 20,
   MeshStyle -> {RGBColor[.5, .5, .5, .5]}, Boxed -> False,
   BoxRatios -> Automatic, Axes -> False,
   PlotStyle -> {RGBColor[.3, .3, .8]}, ImageSize -> {1024, 768},
   Lighting -> {{"Directional", White, ImageScaled[{0, 0, 2.}]}},
   ViewPoint -> {-0.011, -3.043, 1.479}, Background -> Black,
   BoundaryStyle -> RGBColor[.5, .5, .5, .5]],
  Graphics3D[{Directive[Hue[.58, 0, 1],
     Lighting ->
      Join[{{"Ambient", Black}},
       Table[{"Directional", Hue[.58, .5, 1],
         ImageScaled[{Sin[x], Cos[x], -.5}]}, {x, 0, 2 Pi - 2 Pi/8,
         2 Pi/8}]]],
    Sphere[{2 Cos[\[Theta] - \[Pi]/2], 2 Sin[\[Theta] - \[Pi]/2], 3},
     1], Sphere[{Cos[\[Theta] + \[Pi]/2], Sin[\[Theta] + \[Pi]/2], 3},
      1]}], PlotRange -> All]]

Next, I wanted to animate this to give the effect that the spiral arms are rotating outwards. That's done by incrementing the angle Theta and generating a list of frames that can then be exported.
anim = Table[
  Rasterize[
   Show[Plot3D[(
     60 Cos[2 ArcTan[y/(x + 0.00001)] - \[Theta] +
        0.544331 Sqrt[x^2 + y^2]])/(
     20 + Sqrt[x^2 + y^2]), {x, -45, 45}, {y, -45, 45},
     PlotPoints -> 100, Mesh -> 20,
     MeshStyle -> {RGBColor[.5, .5, .5, .5]}, Boxed -> False,
     BoxRatios -> Automatic, Axes -> False,
     PlotStyle -> {RGBColor[.3, .3, .8]}, ImageSize -> {800, 450},
     Lighting -> {{White, ImageScaled[{0, 0, 2.}]}},
     ViewPoint -> {-0.011, -3.043, 1.479},
     Background -> RGBColor[0, 0, 0], BoundaryStyle -> Gray],
    Graphics3D[{Directive[Hue[.58, 0, 1],
       Lighting ->
        Join[{{"Ambient", Black}},
         Table[{"Directional", Hue[.58, .5, 1],
           ImageScaled[{Sin[x], Cos[x], -.5}]}, {x, 0, 2 Pi - 2 Pi/8,
           2 Pi/8}]]],
      Sphere[{2 Cos[\[Theta] - \[Pi]/2], 2 Sin[\[Theta] - \[Pi]/2],
        3}, 1], Sphere[{Cos[\[Theta] + \[Pi]/2],
        Sin[\[Theta] + \[Pi]/2], 3}, 1]}],
    PlotRange -> All]], {\[Theta], 0, 2 \[Pi], .1}];
And then to export it to an animated GIF:
Export["GravityWave.gif", anim]
The result is the animation at the top of this post.