Hi,
what about this
Show[VectorPlot[{y - x^2, x - 2}, {x, -3, 3}, {y, -1, 9}, Epilog -> {PointSize[0.03], Point[{x, y} /. First[Solve[{y - x^2 == 0, x - 2 == 0}]]]},
  Frame -> False, Axes -> True], ContourPlot[{y - x^2 == 0, x - 2 == 0}, {x, -3, 3}, {y, -1, 9}, ContourStyle -> Red]]
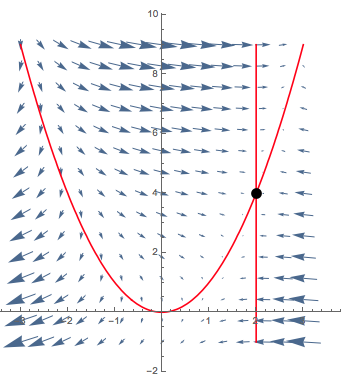
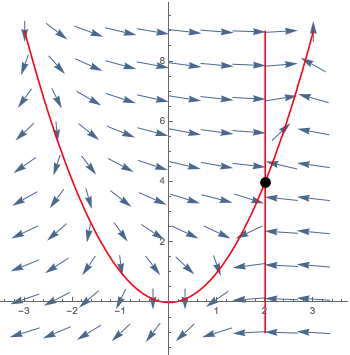
where the length of the arrows represents the magnitude/speed. If you prefer the arrows of equal length like in your book this might work:
Show[VectorPlot[{y - x^2, x - 2}, {x, -3, 3}, {y, -1, 9}, Epilog -> {PointSize[0.03], Point[{x, y} /. First[Solve[{y - x^2 == 0, x - 2 == 0}]]]},
  Frame -> False, Axes -> True, VectorScale -> {Small, Small, None}, VectorPoints -> Coarse, ImageSize -> Medium],
 ContourPlot[{y - x^2 == 0, x - 2 == 0}, {x, -3, 3}, {y, -1, 9}, ContourStyle -> Red]]
Cheers,
Marco


