Group Abstract Group Abstract

Message Boards Message Boards

0
|
7.1K Views
|
3 Replies
|
0 Total Likes
View groups...
Share
Share this post:

Ploting a surface of revolution

Posted 10 years ago

Hi;

I am trying to graph/plot a 3D object that is created when you rotate y = 1/z, about the z-axes, obtaining the surface of revolution x^2 + y^2 = (1/z)^2. The object looks like a cone with a large base starting on the x and y coordinate plane at -2 to 2. The cylinder gets smaller as it moves up the z-axes (with the z-axes in the center of the cylinder) and ends around z = 4 with the diameter of the cone at the top around 1.

Thanks,

Mitch Sandlin

POSTED BY: Mitchell Sandlin
3 Replies

Yes, that is exactly what it says in the documentation of Matlab! This community is on Mathematica. Both products have different functions and syntax. It is very unlikely that Matlab code will work directly in Mathematica. :-)

Cheers,

Marco

POSTED BY: Marco Thiel
Posted 10 years ago

plot::ZRotate(f, x = xmin..xmax) creates a surface of revolution by rotating the function graph z = f(x) with x ? [xmin, xmax] around the z-axis. The slice of the surface parallel to the x-y plane at a point z consists of circles with radii |xi| given by the solutions of f(x) = z.

POSTED BY: Wendy Stirnberg
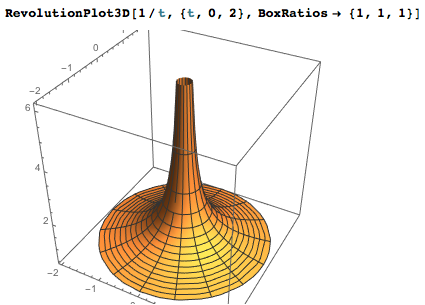
  • Method 1: Use the build-in RevolutionPlot3D function:

    RevolutionPlot3D[1/t, {t, 0, 2}, BoxRatios -> {1, 1, 1}]
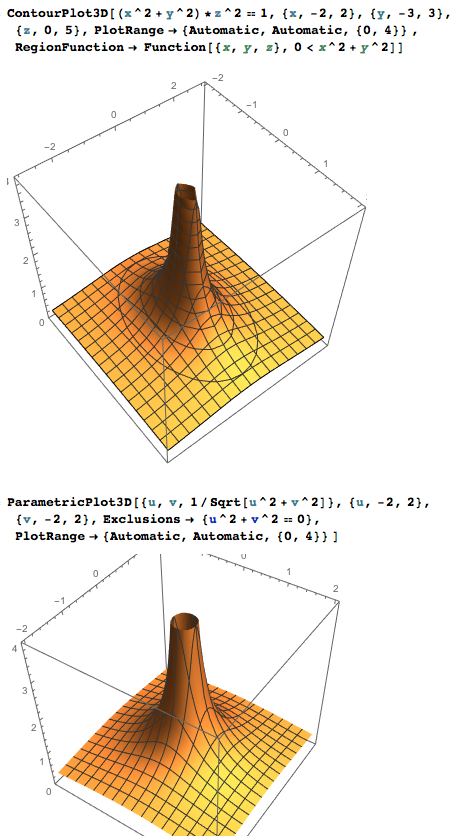
    

enter image description here

  • Method 2:

    ContourPlot3D[(x^2 + y^2)*z^2 == 1, {x, -2, 2}, {y, -3, 3}, {z, 0, 5},PlotRange -> {Automatic, Automatic, {0, 4}} ,RegionFunction -> Function[{x, y, z}, 0 < x^2 + y^2]]
    
  • Method 3:

    ParametricPlot3D[{u, v, 1/Sqrt[u^2 + v^2]}, {u, -2, 2}, {v, -2, 2}, Exclusions -> {u^2 + v^2 == 0}, PlotRange -> {Automatic, Automatic, {0, 4}} ]
    

two ways

POSTED BY: Shenghui Yang
Reply to this discussion
Community posts can be styled and formatted using the Markdown syntax.
Reply Preview
Attachments
Remove
or Discard