For example, you can use output from the colorBlender with the Blend function to create color functions, such as
Blend[{{0,Red},{1,Blue}},x]
which would output a color blend that depends on the value of 'x'. With this format, you can create color maps like you would with ColorData functions, such as
Plot3D[Exp[-x^2 - y^2], {x, -2, 2}, {y, -2, 2}, ColorFunction -> (ColorData["TemperatureMap"][#3] &)]
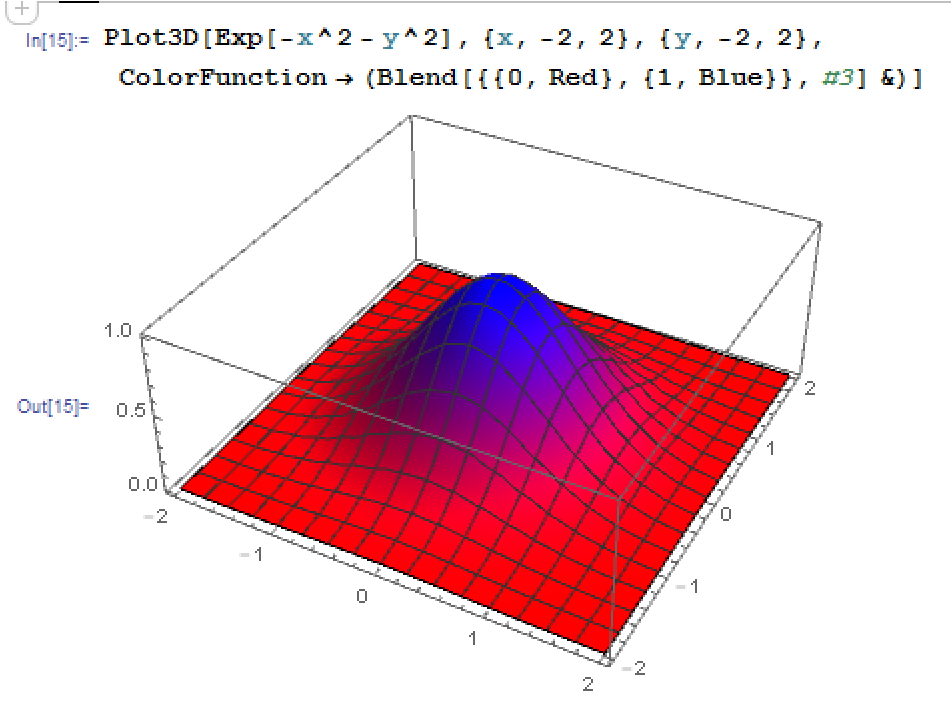
could become instead
Plot3D[Exp[-x^2 - y^2], {x, -2, 2}, {y, -2, 2}, ColorFunction -> (Blend[{{0, Red}, {1, Blue}}, #3] &)]