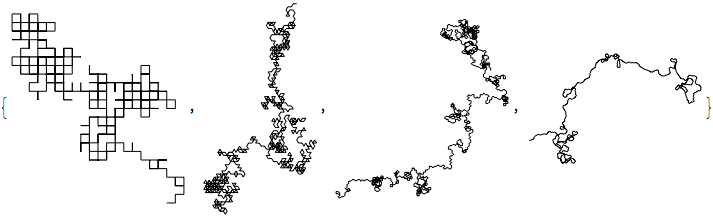
GENE: AVPR1a, STEP: ?/4.5356 GENE: AVPR1a, STEP: ?/4.4
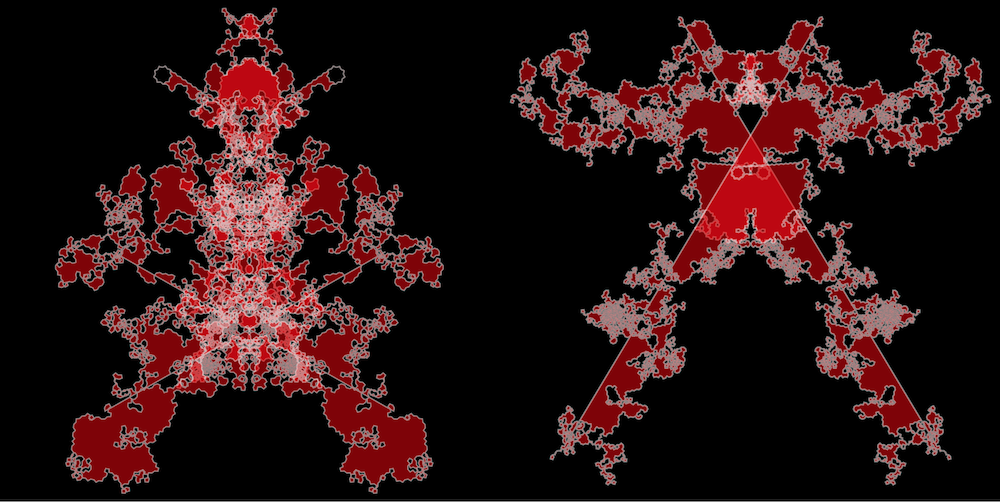
There are numerous examples of abstract art. And it is easy to make a computer-generated abstract forms. But I think it is more interesting to make data-generated art. Then while contemplating an art-piece framed and hanging on your wall, you could be reminded about a particular mystery of life. And a friend of yours can get surprised by a connection that is hard to imagine. Above you can see two images generated from the full DNA sequence of the gene AVPR1a (arginine vasopressin receptor 1A) on the human genome. This gene has also been called "ruthlessness gene" and "altruism gene". Quoting the later reference:
Human altruism is a widespread phenomenon that puzzled evolutionary biologists since Darwin. Economic games illustrate human altruism by showing that behavior deviates from economic predictions of profit maximization. A game that most plainly shows this altruistic tendency is the Dictator Game. We hypothesized that human altruistic behavior is to some extent hardwired and that a likely candidate that may contribute to individual differences in altruistic behavior is the AVPR1a receptor that in some mammals such as the vole has a profound impact on affiliative behaviors.
Now, as we are through with choosing a particular nature mystery, how do we go through with visualizing it? In this particular case we can look at the data given by full DNA sequence of the AVPR1a. We can transform the DNA sequence into a two-dimensional path or walk. It will be pretty random visually. So to induce some artistic perception we will use the same trick as in Klecksography, the art of making images from inkblots. Originally, 100s of years ago, spots of ink were dropped onto a piece of paper and the paper is folded in half, so that the ink will smudge and form a mirror reflection in the two halves. The piece of paper is then unfolded so that the ink can dry, after which someone can guess the resemblance of the print to other objects. The inkblots tend to resemble images because of apophenia, the human tendency to see patterns in nature. While humans tend to see patterns even in noise, the vertical symmetry helps as many objects in nature a left-right symmetric, for example faces and full animal bodies. Since the 1890s, psychologists have used it as a tool for studying the subconscious, most famously Hermann Rorschach in his Rorschach inkblot test. But using interpretation of "ambiguous designs" to assess an individual's personality is an idea that goes back to Leonardo da Vinci and Botticelli.
We start from getting the data for full DNA sequence of the AVPR1a:
gene = GenomeData["AVPR1A", "FullSequence"]
StringLength[gene]
Short[gene]

Out[]= 6375
Out[]= TAATTGCTTGAAGGATTTTTTCCAG...CATGTTTGGGGAATTC
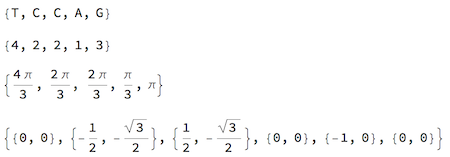
which, as we can see, has 6375 characters A,C,G,T. It is easy to convert them into numbers, then numbers into angles of rotation, and then imagine we are making one step per rotation and build a path from coordinates of these steps:
Characters[gene][[21 ;; 25]]
% /. {"A" -> 1, "C" -> 2, "G" -> 3, "T" -> 4}
% Pi/3
AnglePath[%]
To visualize the path we define a function:
path1[a_]:=Graphics[Line[AnglePath[a Characters[gene][[;;1000]]/.{"A"->1,"C"->2,"G"->3,"T"->4}]]]
path1/@{Pi/2,Pi/3,Pi/4,Pi/10}
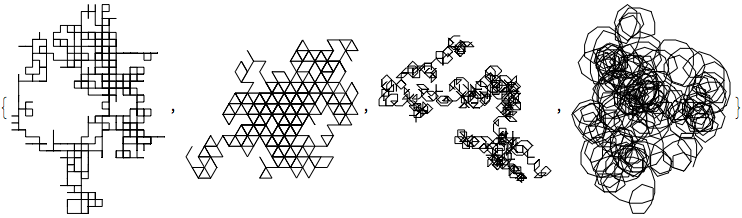
We can see that the rotation angle influences the underlying structure of the path. For $\pi/3$ we are walking on a triangular lattice, for example, while for $\pi/10$ there is no lattice. We can change the steps from positive numbers, to include also negative. So instead of going in circles we will make now steps to the right or left:
path2[a_]:=Graphics[Line[AnglePath[a Characters[gene][[;;1000]]/.{"C"->-2,"G"->-1,"A"->1,"T"->2}]]]
path2/@{Pi/2,Pi/3,Pi/4,Pi/10}
which obviously makes paths more elongated. We can now define a more sophisticated function, that rotates coordinates across $y=x$ line, wraps polygon instead of line around points, and uses better colors and opacity:
Clear@gridSeqSYM;
gridSeqSYM[r_][c_][s_]:=
With[{
    pts=r/@AnglePath[(Pi/c)ReplaceAll[Characters[s],{"C"->-2,"G"->-1,"A"->1,"T"->2}]]
    },
    Graphics[
       {
       EdgeForm[Directive[White,Thickness[.003],Opacity[.5]]],
       FaceForm[Directive[Red,Opacity[.5]]],
       Polygon[pts],
       Polygon[Transpose[{2 First[Mean[pts]]-pts[[All,1]],pts[[All,2]]}]]
       },
       ImageSize->400{1,1},
       Background->Black
    ]
]
We can take any continuous angle of rotation and create nice animations that smoothly transform the paths:
Manipulate[gridSeqSYM[Identity][k]@GenomeData["AVPR1A","FullSequence"],{{k,4.5356},4.4,4.6}]
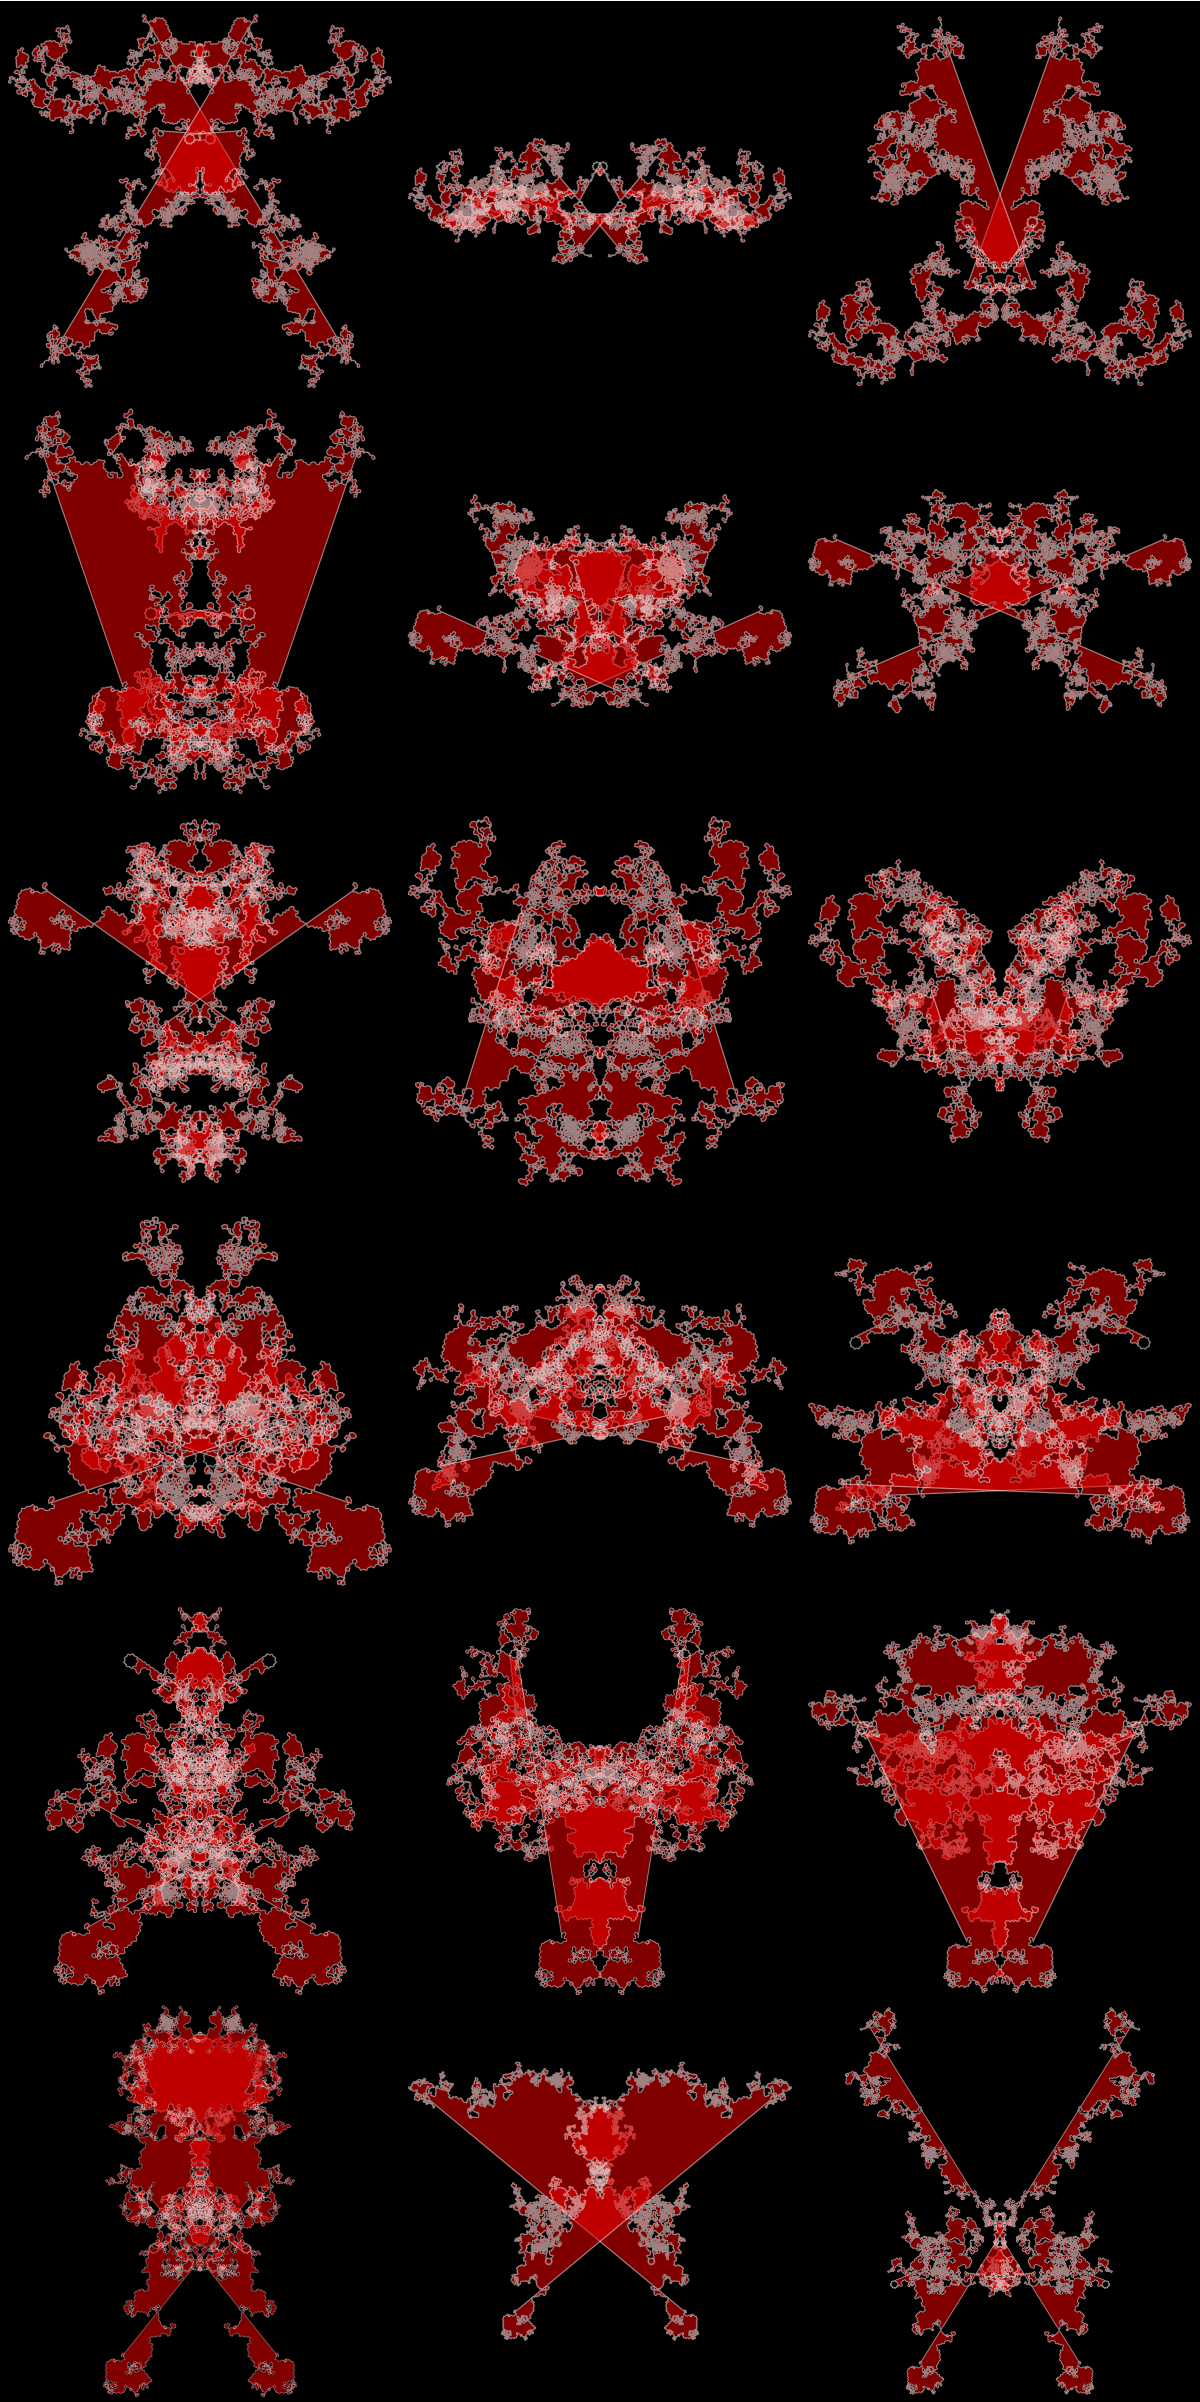
If we like some specific forms we can export them into images or vector graphics and make nice prints. Or we can make a print of a collection of such inkblot, which look more powerful as a multitude of forms.
Grid[Partition[Table[gridSeqSYM[Identity][k]@GenomeData["AVPR1A","FullSequence"],
{k,4.4,4.6,.0113}],3],Spacings->{0, 0}]