Hi Muhammad,
I am no quite sure whether this is what you want to achieve, but one way is to define the following two functions;
cartesianToPolarEqn[eqn_] :=
 Module[{}, eqn /. {Rule @@@ Transpose@{{x, y}, FromPolarCoordinates[{r, \[Phi]}]}}]
and
implicitPolarPlot[eqn_, options : OptionsPattern[]] := Module[{},pl = ContourPlot[eqn, {r, 0, 8 Pi}, {\[Phi], 0, 2 Pi},
PlotPoints -> 100]; g[r_, th_] := {r Cos[th], r Sin[th]};pl[[1, 1]] = g @@@ pl[[1, 1]]; Show[pl, options]]
If you then want to convert your implicit equation into polar coordinates you can do:
cartesianToPolarEqn[(x/a)^2 + (y/b)^2 == 1 ]
which gives:
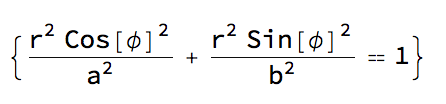
You can then generate a plot of this using:
implicitPolarPlot[(r^2 Cos[\[Phi]]^2)/a^2 + (r^2 Sin[\[Phi]]^2)/b^2 ==1 /. {a -> 1, b -> 2}]
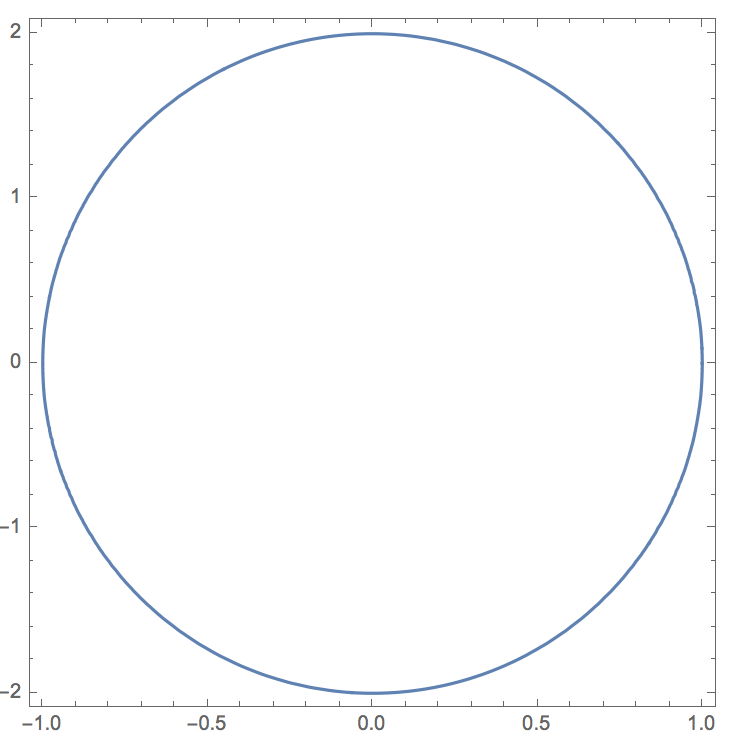
This rescales the axes so that everything looks circular again, but the function also takes additional arguments such that
implicitPolarPlot[(r^2 Cos[\[Phi]]^2)/a^2 + (r^2 Sin[\[Phi]]^2)/b^2 ==1 /. {a -> 1, b -> 2}, PlotRange -> {{-2, 2}, {-2, 2}}]
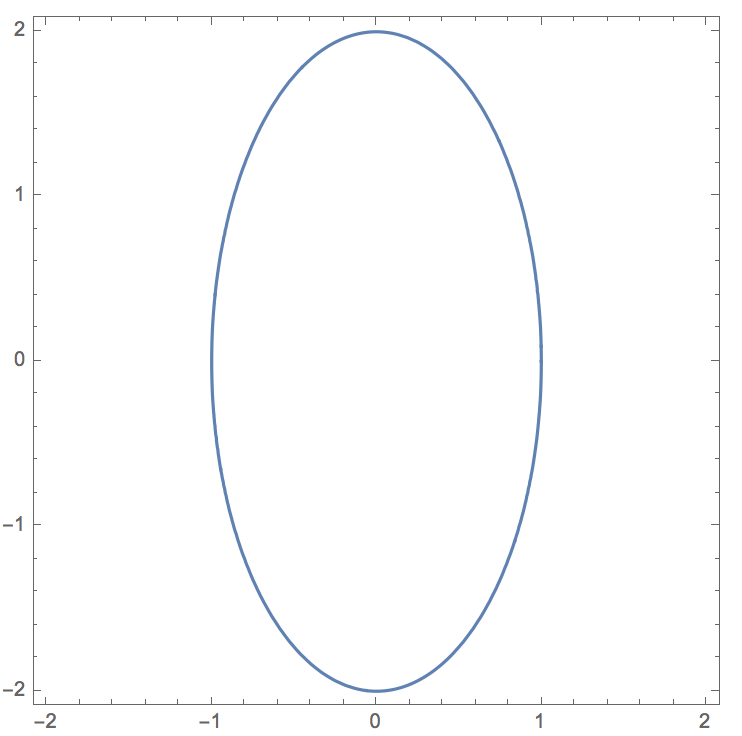
Note that in both cases I needed to specify the parameters "a" and "b".
Cheers,
Marco


