Below is given a function definition that can be used to make a neural network plot with formulae and activation functions graphics. The code/plot can garnished some more, but at this point I find it good enough...
Clear[FormulaNeuralNetworkGraph]
FormulaNeuralNetworkGraph[layerCounts : {_Integer, _Integer, _Integer}] :=
  Block[{gr1, gr2, gr3, gr4, gr, bc},
   gr1 = IndexGraph[CompleteGraph[Take[layerCounts, 2]]];
   gr2 = Graph[Map[(layerCounts[[1]] + #) \[UndirectedEdge] (layerCounts[[1]] + layerCounts[[2]] + #) &, Range[layerCounts[[2]]]]];
   gr3 = IndexGraph[CompleteGraph[Take[layerCounts, -2]], layerCounts[[1]] + layerCounts[[2]] + 1];
   bc = layerCounts[[1]] + 2*layerCounts[[2]];
   gr4 = Graph[Map[(bc + #) \[UndirectedEdge] (bc + layerCounts[[3]] + #) &, Range[layerCounts[[3]]]], VertexLabels -> "Name"];
   gr = GraphUnion[gr1, gr2, gr3, gr4];
   Graph[gr,
    GraphLayout -> {"MultipartiteEmbedding",
      "VertexPartition" -> {layerCounts[[1]], layerCounts[[2]],
        layerCounts[[2]], layerCounts[[3]], layerCounts[[3]]}}]
   ];

Clear[FormulaNeuralNetworkGraphPlot]
Options[FormulaNeuralNetworkGraphPlot] = Options[Graphics];

FormulaNeuralNetworkGraphPlot[layerCounts : {_Integer, _Integer, _Integer}, func1_, opts : OptionsPattern[]] :=
  FormulaNeuralNetworkGraphPlot[layerCounts, func1, # &, opts];

FormulaNeuralNetworkGraphPlot[
   layerCounts : {_Integer, _Integer, _Integer}, func1_, func2_,
   opts : OptionsPattern[]] :=
  Block[{plOpts, grFunc1, grFunc2, gr, vNames, vCoords, vNameToCoordsRules, edgeLines},
   plOpts = {PlotTheme -> "Default", Axes -> True, Ticks -> False, Frame -> True, FrameTicks -> False, ImageSize -> Small};
   grFunc1 = Plot[func1[x], {x, -2, 2}, Evaluate[plOpts]];
   grFunc2 = Plot[func2[x], {x, -2, 2}, Evaluate[plOpts]];

   gr = FormulaNeuralNetworkGraph[layerCounts];
   vNames = VertexList[gr];
   vCoords = VertexCoordinates /. AbsoluteOptions[gr, VertexCoordinates];
   vNameToCoordsRules = Thread[vNames -> vCoords];
   edgeLines = Arrow@ReplaceAll[List @@@ EdgeList[gr], vNameToCoordsRules];

   Graphics[{
     Arrowheads[0.02], GrayLevel[0.2], edgeLines,

     EdgeForm[Black], FaceForm[Gray],
     Map[Disk[#, 0.04] &, vCoords[[1 ;; -layerCounts[[-1]] - 1]]],

     Black,
     Map[{EdgeForm[Gray], FaceForm[White], Disk[#, 0.14],
        Text[Style["\[Sum]", 16, Bold], #]} &,
      Join[
       vCoords[[layerCounts[[1]] + 1 ;; layerCounts[[1]] + layerCounts[[2]]]],
       vCoords[[-2 layerCounts[[-1]] ;; -layerCounts[[-1]] - 1]]
       ]],

     Map[{EdgeForm[None], FaceForm[White],
        Rectangle[# - {0.2, 0.15}, # + {0.2, 0.15}],
        Inset[grFunc1, #1, Center, 0.4]} &,
      vCoords[[ Total[layerCounts[[1 ;; 2]]] + 1 ;; Total[layerCounts[[1 ;; 2]]] + layerCounts[[2]]] ]],

     Map[{EdgeForm[None], FaceForm[White],
        Rectangle[# - {0.2, 0.15}, # + {0.2, 0.15}],
        Inset[grFunc2, #1, Center, 0.4]} &,
      MapThread[Mean@*List, {vCoords[[-2 layerCounts[[-1]] ;; -layerCounts[[-1]] - 1]], vCoords[[-layerCounts[[-1]] ;; -1]]}]]},
    opts]
   ];
Note that the function FormulaNeuralNetworkGraphPlot takes the potions of Graphics.
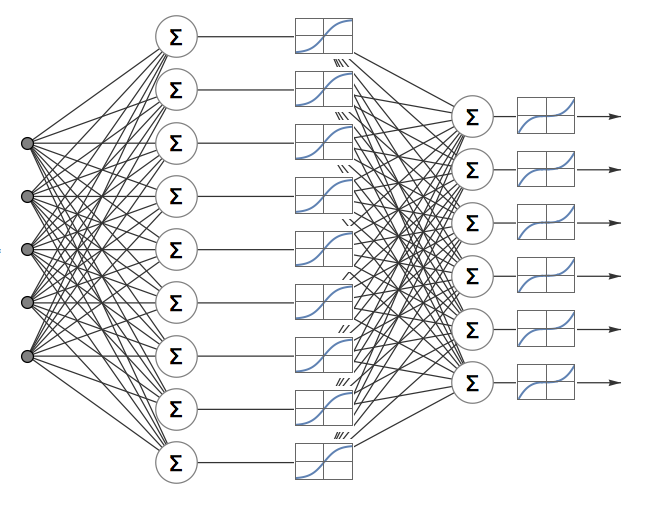
FormulaNeuralNetworkGraphPlot[{5, 9, 6}, Tanh, #^3 &, ImageSize -> 500]
(I tried to reuse as much as I can the code from the answer of Szabolcs. I had to move to using Graphics because I had hard time insetting the activation functions plots using the multi-partite graph options.)


