This post shows how to connect to an accelerometer with the Wolfram Language on a Raspberry Pi.
To recreate this experiment you will need the following hardware (in addition to the Raspberry Pi itself):
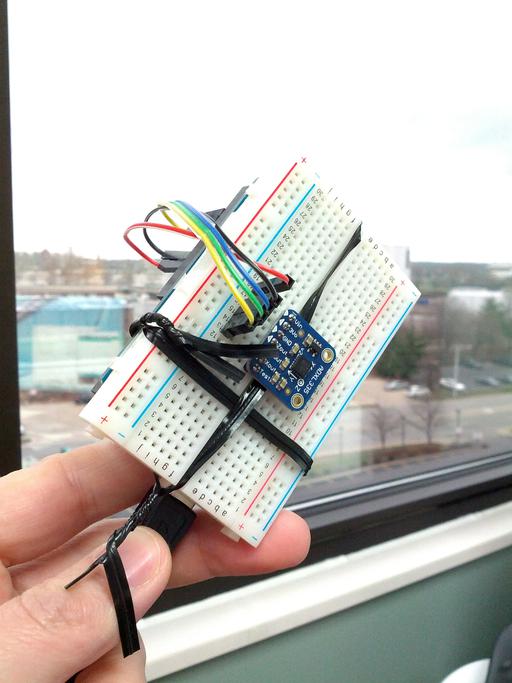
Plug the accelerometer into the breadboard as shown. Use the 5V power pin to connect to Vin. Connect the GND pins. Use A0, A1 and A2 for Xout, Yout and Zout.
Use rubber bands or twist ties to keep the Arduino Uno and the breadboard together, as you will be shaking it hard to generate G forces.

Using the Arduino IDE, upload the following sketch to set up the serial connection to the Wolfram Language:
void setup()
{
Serial.begin(115200);
}
void loop()
{
long x = analogRead(0);
long y = analogRead(1);
long z = analogRead(2);
Serial.print(x);
Serial.print(",");
Serial.print(y);
Serial.print(",");
Serial.print(z);
Serial.print("\n");
delay(100);
}
(You can test that this generates data by opening the Tools -> Serial Monitor in the Arduino IDE)
The Arduino+accelerometer starts to transmit data shortly after power up and will continue to do so until it is unplugged from a power source.
Launch the notebook interface from the command prompt:
> mathematica
You can now open the serial port using the
DeviceOpen by entering:
serial = DeviceOpen["Serial",{"/dev/ttyACM0","BaudRate"->115200}]
This returns a DeviceObject which can be used to read data from.
In this case we use
DeviceReadBuffer to read all available data that has been generated up to this point.
We are going to use 'data' as a list of triplets (x,y,z) which can be plotted dynamically. We also turn off a harmless Take message for a Take command we will use later on:
data = {};
Off[Take::take];
Next we are going to set up a scheduled task which reads off all data from the serial connection. We decode the data by running it through Import[...,"CSV"] and
scrubbing it with Cases to make sure we only admit (x,y,z) integer triplets:
task = RunScheduledTask[
Module[{csv, raw},
csv = FromCharacterCode[DeviceReadBuffer[serial]];
raw =
Cases[ImportString[csv, "CSV"], {_Integer, _Integer, _Integer}];
data = Join[data, raw];
], 1];
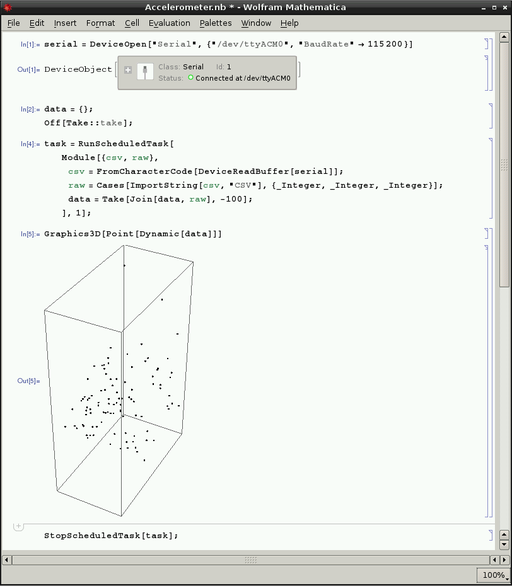
As a last step we can visualize the accelerometer (x,y,z) values by plotting them in a 3D point cloud (and shaking the accelerometer in various orientations):
Graphics3D[Point[Dynamic[data]]]
