Recently, news was announced that the largest impact basin in the solar system, the South Pole - Aitken Basin on the Moon, was found to have a mass anomaly buried beneath it. This mass anomaly is believed to be the remnants/core of the object that impacted the area billions of years ago. The news provides some maps showing the approximate location of the anomaly. I was curious if I could reproduce this visualization and I came up with the following 2 variants.
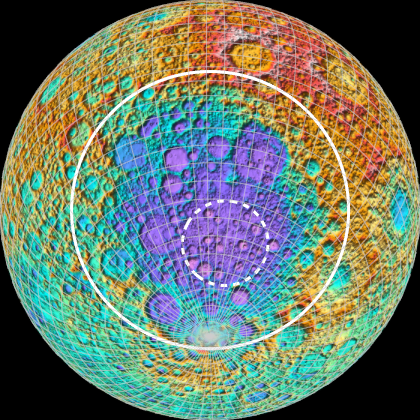
By default, the ReliefMap in the Wolfram Language includes lighting effects to emphasize the topography a bit better.
With[{data =
   Entity["SolarSystemFeature",
     "SouthPoleAitkenBasinMoon"][{"Position", "Size"}]},
 GeoGraphics[{White, Thickness[.007],
   GeoCircle[data[[1]], data[[2]]/2], Dashing[.015],
   GeoCircle[
    GeoPosition[{-62., 200.}, Entity["PlanetaryMoon", "Moon"]],
    data[[2]]/7]}, GeoBackground -> "ReliefMap",
  GeoProjection -> {"Orthographic", "Centering" -> data[[1]]},
  GeoRange -> All, GeoZoomLevel -> 2, Background -> Black,
  GeoGridLines -> Quantity[5, "AngularDegrees"],
  GeoGridLinesStyle -> GrayLevel[{0.8, 0.6}]]]
But the published versions lack this lighting effect and go for a flatter appearance which can be achieved by changing the GeoBackground option a bit.
With[{data =
   Entity["SolarSystemFeature",
     "SouthPoleAitkenBasinMoon"][{"Position", "Size"}]},
 GeoGraphics[{White, Thickness[.007],
   GeoCircle[data[[1]], data[[2]]/2], Dashing[.015],
   GeoCircle[
    GeoPosition[{-62., 200.}, Entity["PlanetaryMoon", "Moon"]],
    data[[2]]/7]},
  GeoBackground -> GeoStyling["ReliefMap", LightingAngle -> None],
  GeoProjection -> {"Orthographic", "Centering" -> data[[1]]},
  GeoRange -> All, GeoZoomLevel -> 2, Background -> Black,
  GeoGridLines -> Quantity[5, "AngularDegrees"],
  GeoGridLinesStyle -> GrayLevel[{0.8, 0.6}]]]
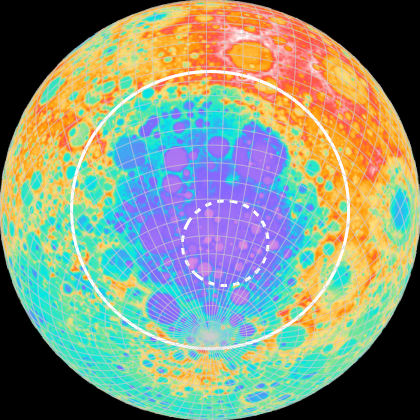
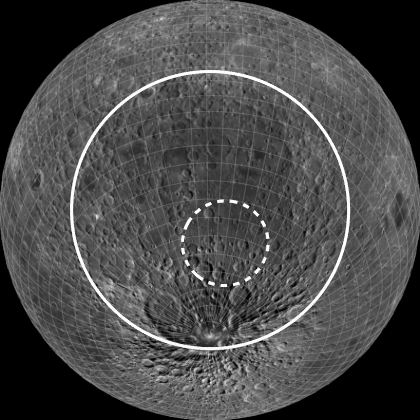
In both cases, I have added an additional circle showing the outer boundary of the Aitken Basin. The size of the circle representing the anomaly is determined based on visual inspection of the original graphic.
Without the relief highlighted, photographic satellite views make the Aitken Basin harder to see:
With[{data =
   Entity["SolarSystemFeature",
     "SouthPoleAitkenBasinMoon"][{"Position", "Size"}]},
 GeoGraphics[{White, Thickness[.007],
   GeoCircle[data[[1]], data[[2]]/2], Dashing[.015],
   GeoCircle[
    GeoPosition[{-62., 200.}, Entity["PlanetaryMoon", "Moon"]],
    data[[2]]/7]},
  GeoProjection -> {"Orthographic", "Centering" -> data[[1]]},
  GeoRange -> All, GeoZoomLevel -> 2, Background -> Black,
  GeoGridLines -> Quantity[5, "AngularDegrees"],
  GeoGridLinesStyle -> GrayLevel[{0.8, 0.2}]]]