Message Boards Message Boards

3
|
28121 Views
|
3 Replies
|
7 Total Likes
View groups...
Share
Share this post:

Export as 3D file type STL for 3D printing

hi all,

i have a ContourPlot of an equation and would like to export it as a 3D file type.
ContourPlot3D[ x^2 + y^2 - x^2*z + y^2*z + z^2 - 1 == 0, {x, -3, 3}, {y, -3,   3}, {z, -3, 3}]

can anyone tell me what to add to something like this in order to get it out as a 3D file but also /where/ i should expect this file to go?

i am searching the help database and must admit that i sometimes have to be shown how to do these things since the pickorder and/or the syntax sometimes is hard for me to figure out.

thanks in advance for any help.

Jon
POSTED BY: Jonathan Chertok
3 Replies
Jonathan, welcome to the Wolfram Community! There is already a post on 3D printing I recommend to read:

Creating a 3D mesh plot and exporting it to an STL file for 3D printing

C ormullion suggested a good possible solution. I still think we can at least try to print your original plot by increasing thickness of surface and joint points:
object = ContourPlot3D[x^2 + y^2 - x^2*z + y^2*z + z^2 - 1 == 0.01,
{x, -3, 3}, {y, -3, 3}, {z, -3, 3}, ContourStyle -> Thickness[0.2], Mesh -> False, PlotPoints -> 40]


Now we need to export to STL and you can see the directory used for that (unless you specify a custom one) as:
In[1]:= Directory[]
Out[1]= "/Users/vitaliyk"

To export and then check STL file is OK,  open STL file with your 3D Printing software or again with Mathematica: 
Export["object.stl", object]
Import[%]

POSTED BY: Vitaliy Kaurov
I don't think that will work out very well as it stands - there are disconnected pieces (although you might be able to print each one separately). I tried:
shape = RegionPlot3D[x^2 + y^2 - x^2*z + y^2*z + z^2 - 1 < 0.25,
{x, -3, 3},
{y, -3, 3},
{z, -3, 3},
Mesh -> 20,
Boxed -> False,
Axes -> None,
PlotStyle -> Thickness[.1]]
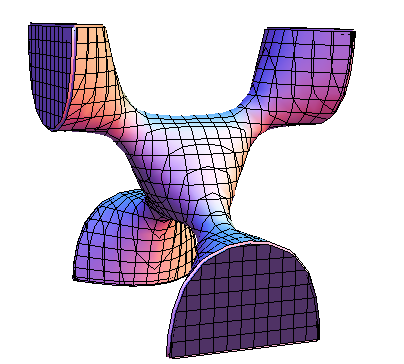
Export["/Users/me/Desktop/shape.stl", shape]
It's close to being printable, at least - but obviously not identical to the plot you want. If you print it in inches, it's 6 inches across. You will want to experiment with increasing the "detail" (PlotPoints -> n, for example). And the shape might require 'fixing' in an external program, because Mathematica doesn't always get the geometry right inside shapes (for example, there might be self-intersecting surfaces, etc.) In my experience it isn't always as easy as people say. emoticon
POSTED BY: C ormullion
@Vitaliy - That's much better than my attempt! I didn't know you could do ContourStyle -> Thickness[0.2]... :-)
POSTED BY: C ormullion
Reply to this discussion
Community posts can be styled and formatted using the Markdown syntax.
Reply Preview
Attachments
Remove
or Discard

Group Abstract Group Abstract