This is part of a series where I explore some of the videos of Numberphile, see also the other ones:
Today we are gonna look at another video on graphs: https://www.youtube.com/watch?v=j0o-pMIR8uk
The first sequence (https://oeis.org/A002487) can, conveniently be recreated by using Riffle:
data = NestList[Riffle[#, Total /@ Partition[#, 2, 1]] &, {1, 1}, 13];
data = Join @@ data[[All, ;; -2]];
ListPlot[data]
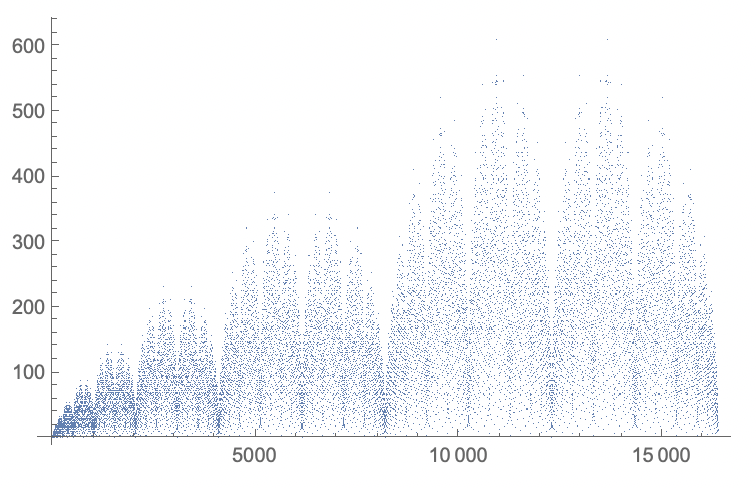
The second sequence (https://oeis.org/A005185) can be recreated like this:
Dynamic[i]
n = 100000;
x = ConstantArray[1, n];
Do[
 os = {x[[i - 2]], x[[i - 1]]};
 tot = x[[i - os]];
 x[[i]] = Total[tot];
 ,
 {i, 3, n}
 ]
giving:
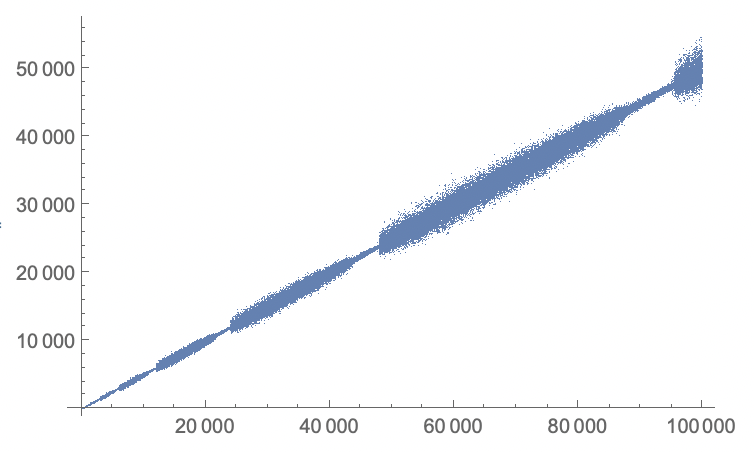
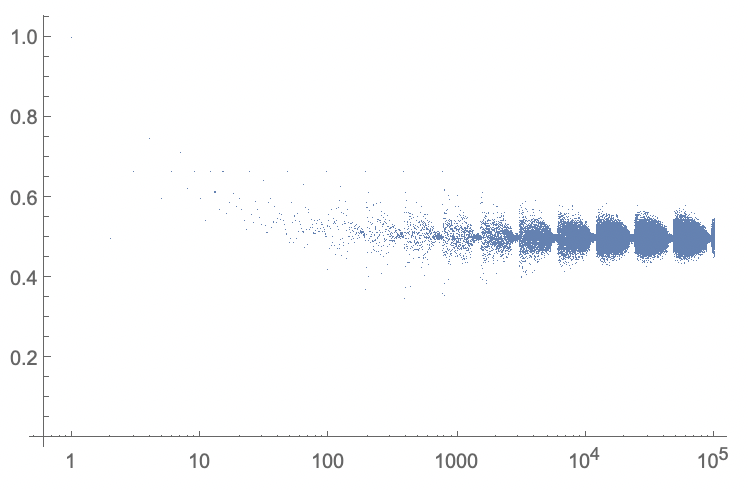
An alternative view would be to plot it logarithmically in the horizontal direction, and to divide the sequence by the index of each number:
tmp = N[x];
tmp /= Range[Length[tmp]];
ListLogLinearPlot[tmp, PlotRange -> All]
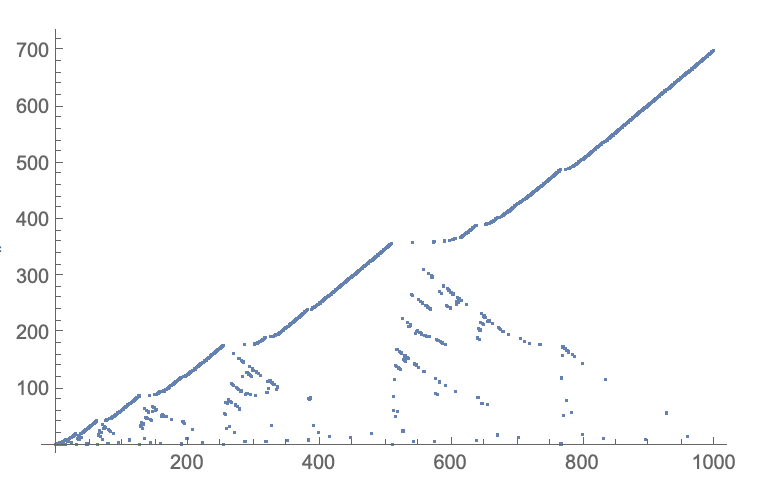
The last sequence (https://oeis.org/A279125) can be recreated like this:
n=1000;
x=ConstantArray[0,n];
Dynamic[i]
Do[
 k=-1;
 ok=False;
 While[!ok,
  k++;
  good=True;
  Do[
   If[x[[j]]==k,
    If[BitAnd[i,j]>0,
     good=False;
     Break[];
    ]
   ]
  ,
  {j,1,i-1}
  ];
  If[good==True,
   x[[i]]=k;
   Break[];
  ]
 ]
,
 {i,2,n}
]
ListPlot[x]
giving:
Perhaps someone can provide a faster implementation? Hope you enjoyed these codes, perhaps you can modify them and make them more intricate/faster/better!


