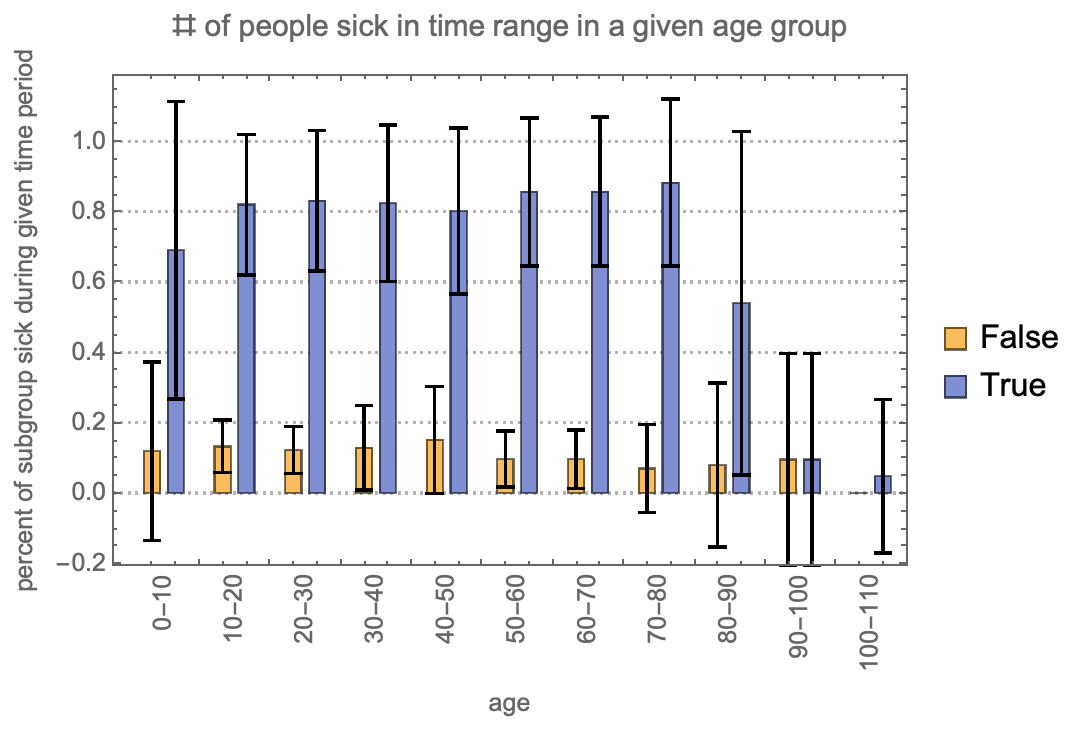
for the 2-level bar chart in update 1, using a legend for the bar colors for True and False would allow you to use the age group labels along the horizontal axis. Here is a simple hack of your BarChart that accomplishes this:
BarChart[First /@ visualizeThis, Frame -> True,
 FrameLabel -> {"age",
   "percent of subgroup sick during given time period"},
 PlotTheme -> "Detailed",
 ChartLabels -> {Rotate[#, Pi/2] & /@ Last /@ visualizeThis, None},
 ChartLegends -> {False, True},
 PlotLabel -> "# of people sick in time range in a given age group"]