Message Boards Message Boards

[GIF] Riemann Hypothesis video from Quanta Magazine

I just wanted to share Quanta Magazine's new explainer video on the Riemann Hypothesis, to which I contributed a number of animations: https://youtu.be/zlm1aajH6gY The full Quanta Magazine article can be found here: How I Learned to Love and Fear the Riemann Hypothesis.

Here's a GIF of part of the spiral animation :
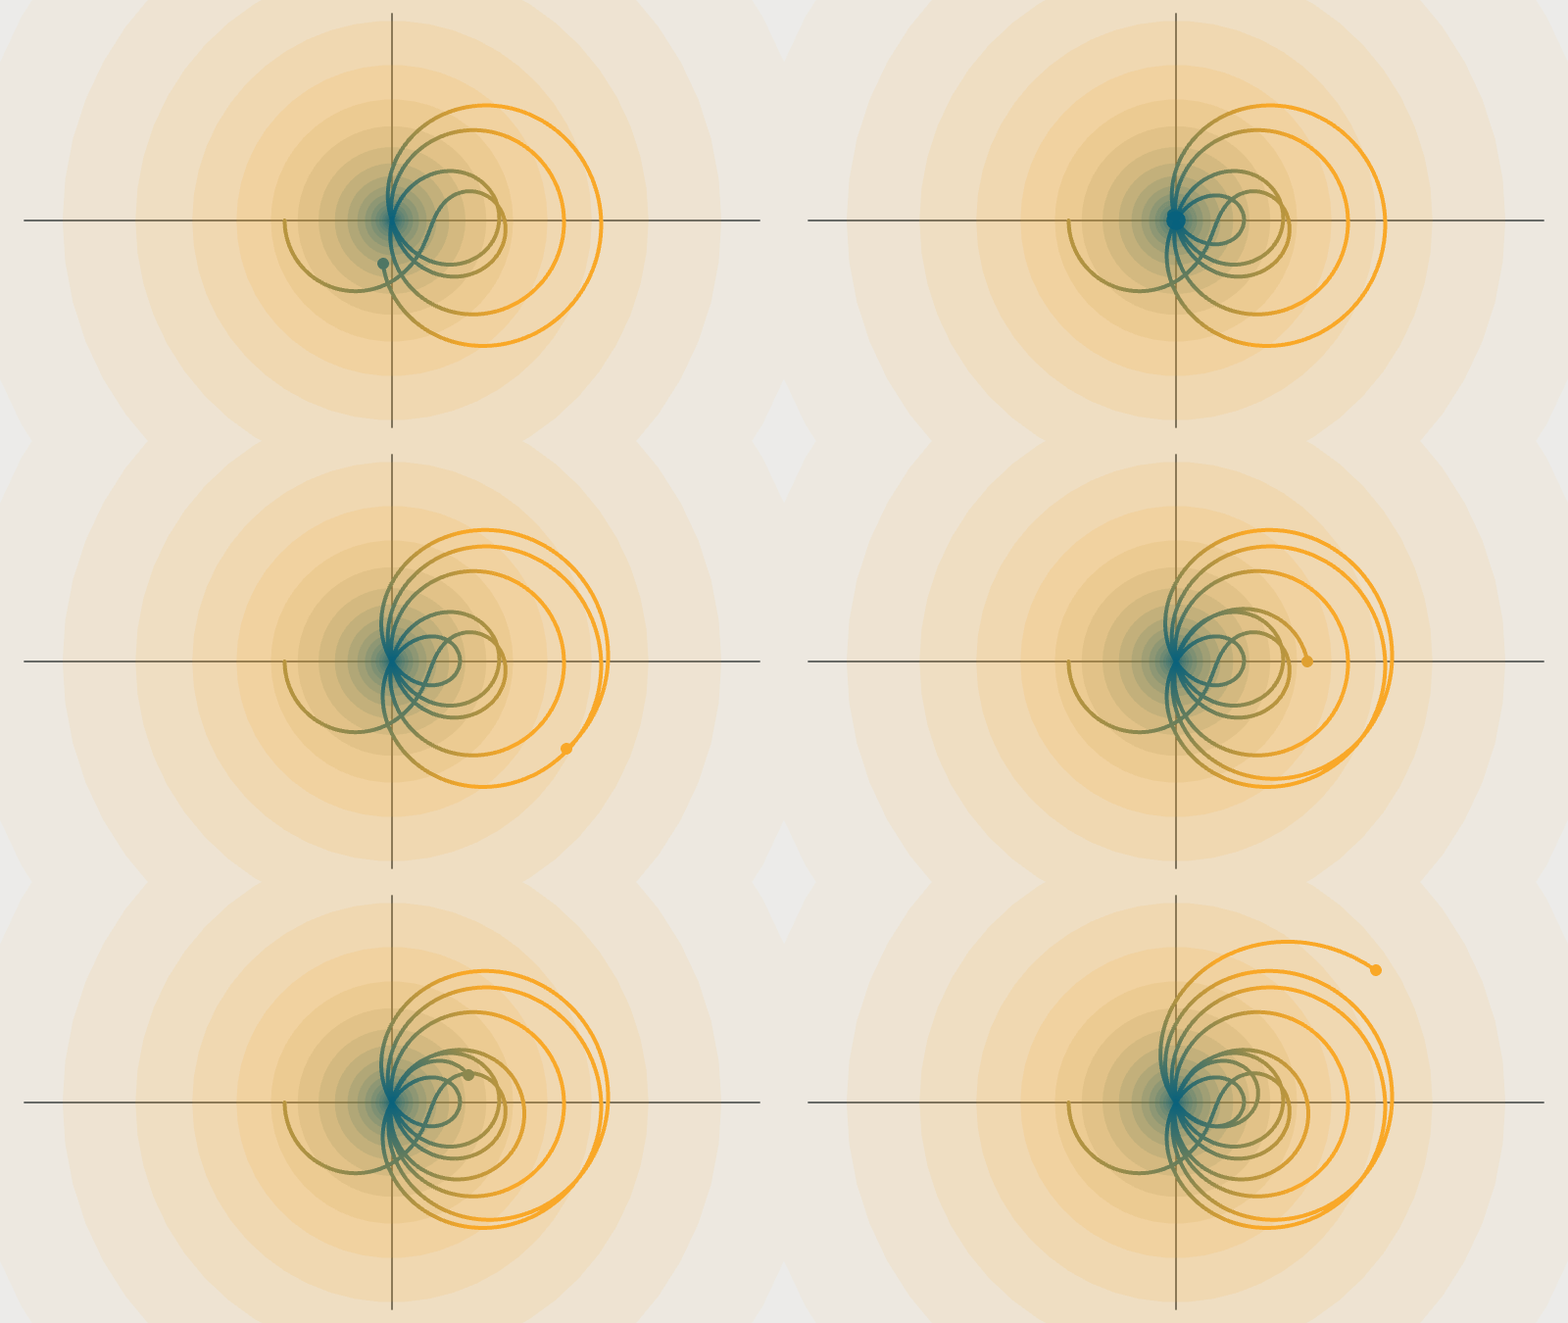
Image of critical line under the zeta function

And here's a Manipulate version of the spiral animation:

zetazeros = Table[N[Im[ZetaZero[i]]], {i, 1, 20}];

DynamicModule[{diffs, pos, xaxesLength = 5, yaxesLength = 9/16*5, 
  range = 3, tmax = 55, axesColor, 
  cols = RGBColor /@ {"#07617d", "#f9a828", "#2e383f", "#ececeb"}, 
  n = Length[zetazeros]},
 axesColor = cols[[3]];
 Manipulate[
  diffs = Table[a - zetazeros[[i]], {i, 1, n}];
  pos = Position[diffs, x_ /; 0 < x < 1];
  Show[Graphics[{axesColor, Thickness[.002], 
     Line[{{-xaxesLength, 0}, {xaxesLength, 0}}], 
     Line[{{0, -yaxesLength}, {0, yaxesLength}}], 
     Reverse@Table[{Opacity[(8 - E^r)/48], Blend[cols[[;; 2]], E^r/2],
         Disk[{0, 0}, E^r]}, {r, -5, 5, 1/4}]}],
   ParametricPlot[ReIm[Zeta[1/2 + I t]], {t, 0, a}, 
    PlotStyle -> Directive[Thickness[.005], CapForm["Round"]], 
    ColorFunctionScaling -> False, 
    ColorFunction -> 
     Function[{x, y, t}, Blend[cols[[;; 2]], Norm[{x, y}]/2]]], 
   Graphics[{Blend[cols[[;; 2]], Abs[Zeta[1/2 + I a]]/2], 
     PointSize[.015], Point[ReIm[Zeta[1/2 + I a]]], cols[[1]], 
     If[Length[pos] >= 1, {Opacity[1 - diffs[[pos[[1, 1]]]]], 
       Disk[{0, 0}, 2 diffs[[pos[[1, 1]]]]]}]}], 
   ImageSize -> 50 {16, 9}, Background -> cols[[-1]], 
   PlotRange -> range {{-16/9, 16/9}, {-1, 1}}],
  {a, .0001, tmax, (tmax - .0001)/840}]
 ]
11 Replies

Congratulations! Your post was highlighted on the Wolfram's official social media channels. Thank you for your contribution. We are looking forward to your future posts.

POSTED BY: EDITORIAL BOARD

The segments I animated are probably not hard to guess. They are:

0:00–0:27

2:47–3:26

3:52–3:59

9:05–9:30

9:53–12:31

12:58–14:36

The other animations were done by an actual professional motion graphics designer, Guan-Huei Wu.

Fixed that, I could see it myself, but not others. Now removed the music and reuploaded. link updated.

POSTED BY: Sander Huisman
Posted 4 years ago

Hi Sander,

Looks like the video is no longer available on YouTube

Video unavailable This video contains content from WMG, who has blocked it on copyright grounds.

POSTED BY: Rohit Namjoshi

No worries, even just knowing which ones you created would be interesting, and would open my mind of the possibilities of what Mathematica can do… (I, for example, have made this in Mathematica and also ffmpeg).

POSTED BY: Sander Huisman

Unfortunately, the others were all produced in multiple parts, which were stitched together at the end with FFmpeg (for example, the sequence from 12:59–14:36 in the video consists of 11 separate parts). In the end I think it's something like 40 different parts spread over 7 different notebooks, so the effort of putting it all together into something comprehensible will be substantial.

Not to say I won't do it at some point, but, given that our semester is starting soon and I have a lot else going on, it's not at the top of my priority list at the moment.

Fantastic! Are you gonna share the others? They are really nice!

POSTED BY: Sander Huisman
Posted 4 years ago

A very interesting thing to look at with the "zeta spiral" is Lehmer's phenomenon, which manifests itself as a near-cusp at the origin. Stripping down Clayton's code from above, here's how to visualize the first Lehmer pair:

ParametricPlot[ReIm[Zeta[1/2 + I t]], {t, 7005, 7005 + 1/8}, 
               Background -> RGBColor["#ececeb"], ColorFunctionScaling -> False, 
               ColorFunction -> Function[{x, y, t},
                                         Blend[{RGBColor["#07617d"],
                                                RGBColor["#f9a828"]},
                                               Norm[{x, y}]/2]],
               Frame -> True, PlotRange -> {-0.01, 0.01}, 
              PlotStyle -> Directive[Thickness[0.005], CapForm["Round"]]]

first Lehmer pair on the zeta spiral

If the spiral did not in fact hit the origin, then the hypothesis would be false there. The MathWorld page I linked to has examples of other Lehmer pairs.

Another nice thing to look at using the spiral would be the Gram points.

POSTED BY: J. M.

Wow, such an exquisite work, thanks for sharing! Just finished watching the video and reading the article, -- the animations are greatly educational. Besides the elegance of maths in your animations I also always enjoy your color schemes :-) Congrats on Quanta Magazine collaboration!

POSTED BY: Vitaliy Kaurov

enter image description here -- you have earned Featured Contributor Badge enter image description here Your exceptional post has been selected for our editorial column Staff Picks http://wolfr.am/StaffPicks and Your Profile is now distinguished by a Featured Contributor Badge and is displayed on the Featured Contributor Board. Thank you!

POSTED BY: EDITORIAL BOARD
Reply to this discussion
Community posts can be styled and formatted using the Markdown syntax.
Reply Preview
Attachments
Remove
or Discard

Group Abstract Group Abstract