Hi everyone,
this is a really nice discussion. Together with the recent blog post, there is not much I can contribute, but I made a couple of observations that I would like to add anyway. I used the transcript in Alan Joyce's post above, so I will assume that we have his variable textRaw and then use exactly the same functions taken (stolen?) from his fantastic post:
debateBySpeaker =
  StringJoin /@
   GroupBy[StringSplit[#, ": ", 2] & /@
      StringTrim /@
       StringSplit[
        StringDelete[
         StringReplace[
          StringReplace[
           StringDelete[textRaw,
            "\n" | "(APPLAUSE)" | "(LAUGHTER)" | "(CROSSTALK)" |
             "(COMMERCIAL BREAK)" | ("UNKNOWN") | "know" | "going" |
             "think" | "people" | "say" | "said" | "country" |
             "want" | "need"], "..." -> " "],
          name : RegularExpression["[A-Z ]+:"] :> "\n" <> name],
         RegularExpression["\[[a-z ]+\]"]], "\n"], First][[All, All,
    2]];

candidates = {"TRUMP", "BUSH", "WALKER", "RUBIO", "CHRISTIE",
   "CARSON", "PAUL", "CRUZ", "HUCKABEE", "KASICH", "FIORINA"};
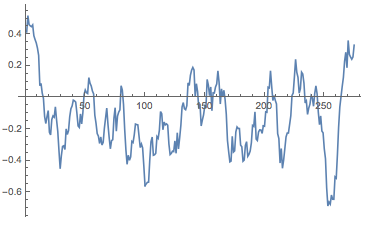
Sentiments appear to be crucial in these debates and recent functionality of the Wolfram Language is really useful in this context. For a recent analysis I did on the sentiments in about 10000 books (which I can post if there is any interest), I developed a little function that uses the Wolfram Language's sentiment analysis feature. The Classify function also gives probabilities which I use as weights to get better estimates. Here is the call for Mr. Trumps contribution:
sentimentlistTrump = -"Negative" + "Positive" /. ((Classify["Sentiment", #, "Probabilities"] & /@ #) & @ TextSentences@Part[debateBySpeaker[#] & /@ candidates, 1]);
It turns out that a little bit of averaging is in order. In books I use more sentences but the candidates' contributions are rather short so I will use a window of ten sentences.
MovingAverage[sentimentlistTrump, 10] // ListLinePlot
Calculating the sentiment lists for all candidates is straight forward now:
sentimentlist = Table[-"Negative" + "Positive" /. ((Classify["Sentiment", #, "Probabilities"] & /@ #) & @ TextSentences@Part[debateBySpeaker[#] & /@ candidates, k]), {k, 1, Length[candidates]}];
The number of sentences spoken depends very much on the candidate. Therefore, I "normalise" all contributions to length 1, or 100%. That looks like this:
ArrayReshape[
  ListLinePlot[
     Transpose@{Range[Length[#[[2]]]]/Length[#[[2]]], #[[2]]},
     PlotLabel -> #[[1]], Filling -> Axis, ImageSize -> Medium,
     Epilog -> {Red,
       Line[{{0, Mean[#[[2]]]}, {1, Mean[#[[2]]]}}]}] & /@
   Transpose@{candidates, sentimentlist}, {6, 2}] // TableForm
The red line shows the "average sentiment"; it is interesting that it is negative for all but two candidates. Also, everybody starts on a positive note and many end positively. This calls for a little further analysis. I first generate a list of the lengths of all sentences spoken by each candidate. I will use this to plot a histogram of sentence lengths.
wordspersentence = ((Length /@ (TextWords /@ TextSentences[#]))) & /@ (debateBySpeaker[#] & /@ candidates);
We can now generate a little dataset like so:
Dataset[<|"Candidate" -> #[[1]], "Mean" -> Mean[#[[2]]],
    "Variance" -> Variance[#[[2]]], "sentences" -> Length[#[[2]]],
    "Length sentences" ->
     Histogram[#[[3]], 100, PlotTheme -> "Marketing",
      FrameLabel -> {"# words", "frequency"}, ImageSize -> 200,
      PlotRange -> {{0, 100}, All}]|> & /@
  Transpose[{candidates, sentimentlist, wordspersentence}]]
The "mean" column describes the mean sentiment; apart from candidates Cruz and Kasich all are negative. The most negative is Mr Carson. The variance is calculated for the sentiments, too. Mr. Trump's statements seem to have the largest variation of sentiments, i.e. he seems to display more extreme/emotional statements/sentiments than the other candidates. Mr Trump appears to say many more sentences than the others, and seems to be dominating the debate in terms of number of sentences.
I then thought that it might be a good idea to look at the WordClouds separately for all the positive and all the negative statements. What words would candidates use in positive and which ones in negative statements?
Monitor[posnegCloud =
  Table[<|"Candidate" -> candidates[[k]],
    "pos WordCloud" ->
     WordCloud[
      DeleteStopwords[
       Flatten[TextWords[
         Select[Transpose[{sentences[[k]],
             sentimentlist[[k]]}], #[[2]] > 0 &][[All, 1]]]]],
      IgnoreCase -> True],
    "neg WordCloud" ->
     WordCloud[
      DeleteStopwords[
       Flatten[TextWords[
         Select[Transpose[{sentences[[k]],
             sentimentlist[[k]]}], #[[2]] < 0 &][[All, 1]]]]],
      IgnoreCase -> True]|>, {k, 1, Length[candidates]}], k]
I use Monitor to be updated on the progress of the calculation. When it's done, I create a dataset:
posnegdata=Dataset[posnegCloud]
It is much better to see when you run it on your computer and can properly enlarge it. We can display entries like so:
posnegdata[2]
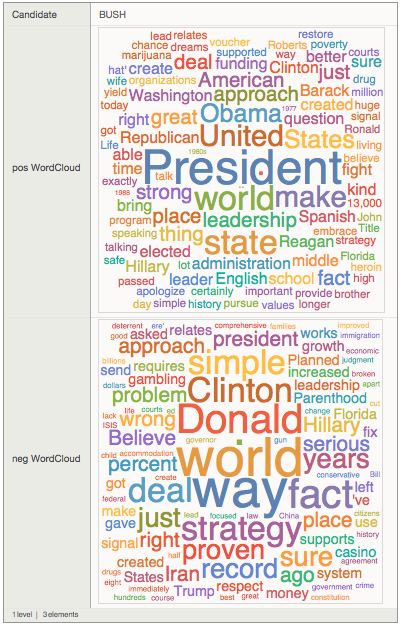
It is interesting to see that Mr Trump comes up very prominently in the negative sentences of Mrs Fiorina. "Donald" appears in negative sentences of Mr Bush. It looks like an interesting social network. Well, let's have a look at that. We first see which candidates uses which other candidates name.
adjacency1=Table[Length[Select[sentences[[i]], Evaluate[StringContainsQ[#, candidates[[j]], IgnoreCase -> True] &]]], {j, 1, Length[candidates]}, {i, 1, Length[candidates]}];
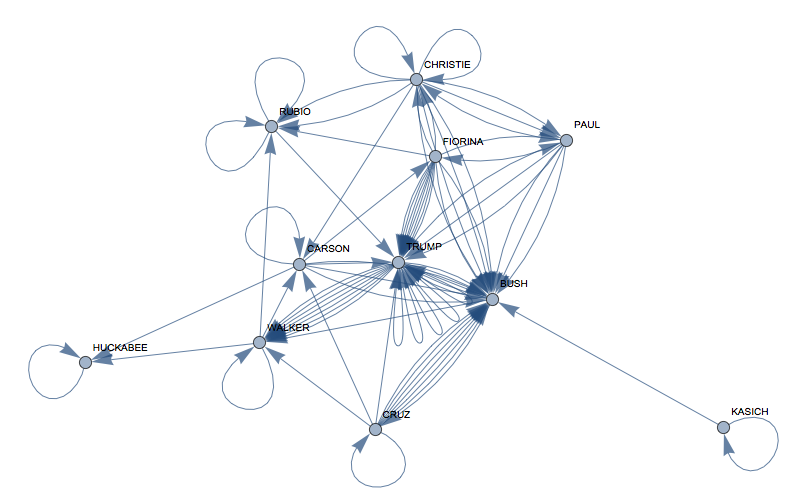
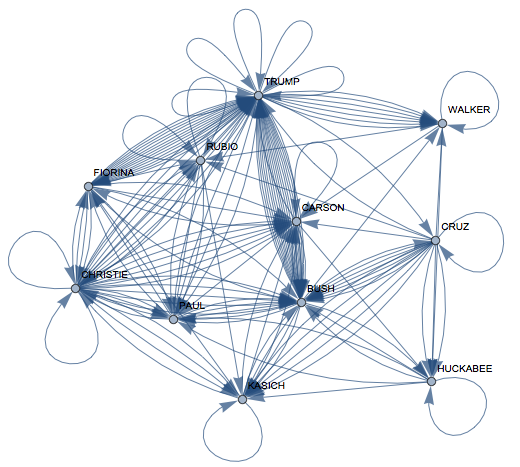
We can then plot the corresponding graph:
interactions =
 AdjacencyGraph[
  Transpose@
   Table[Length[
     Select[sentences[[i]],
      Evaluate[
       StringContainsQ[#, candidates[[j]],
         IgnoreCase -> True] &]]], {j, 1, Length[candidates]}, {i, 1,
     Length[candidates]}],
  VertexLabels -> Rule @@@ Transpose[{Range[11], candidates}]]
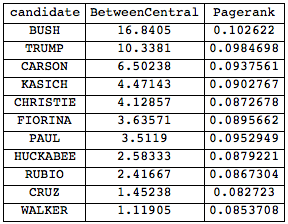
and calculate some "importance measures":
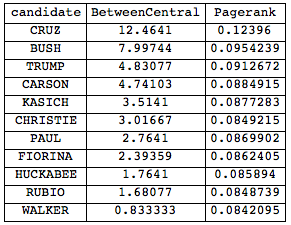
Grid[Join[{{"candidate", "BetweenCentral", "Pagerank"}},
  Reverse@SortBy[
    Transpose[{candidates, BetweennessCentrality[interactions],
      PageRankCentrality[interactions, 0.1]}], #[[2]] &]],
 Frame -> All]
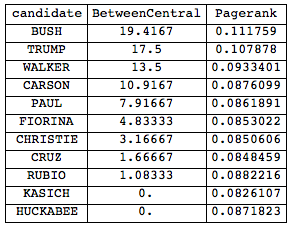
This show that interestingly Mr Bush seems to be most central to the debate. Unfortunately, this last analysis is incorrect. I only checked for the surnames, but the word clouds told us that for example Mr Bush uses "Donald". Luckily, this is not difficult to fix. We first need the given names of the candidates:
givennames = {"Donald", "Jeb", "Scott", "Marco", "Chris", "Ben", "Rand", "Ted", "Mike", "John", "Carly"};
to generate their full names:
fullnames = Transpose[{givennames, candidates}]
(*{{"Donald", "TRUMP"}, {"Jeb", "BUSH"}, {"Scott", "WALKER"}, {"Marco",
  "RUBIO"}, {"Chris", "CHRISTIE"}, {"Ben", "CARSON"}, {"Rand",
  "PAUL"}, {"Ted", "CRUZ"}, {"Mike", "HUCKABEE"}, {"John",
  "KASICH"}, {"Carly", "FIORINA"}}*)
Then as before:
interactionsfull =
 AdjacencyGraph[
  Transpose@
   Table[Length[
     Select[sentences[[i]],
      Evaluate[
       StringContainsQ[#, fullnames[[j]],
         IgnoreCase -> True] &]]], {j, 1, Length[candidates]}, {i, 1,
     Length[candidates]}],
  VertexLabels -> Rule @@@ Transpose[{Range[11], candidates}]]
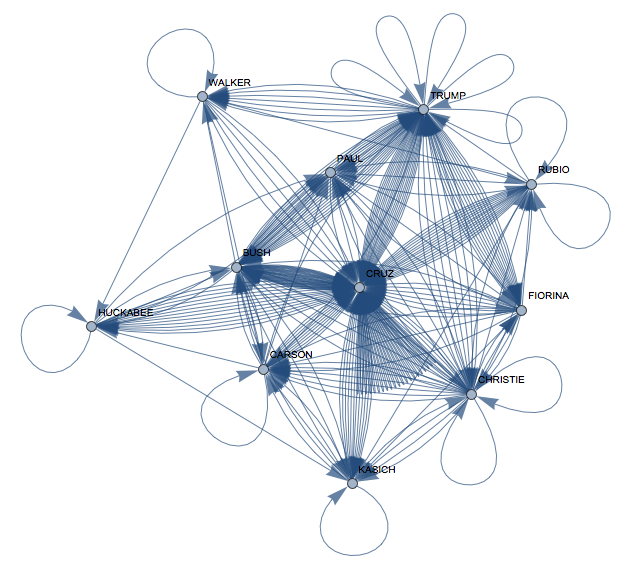
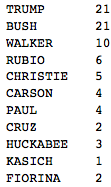
Interesting, now Mr Cruz appears to be quite central. Our graph measures look like this:
Now, both Mr Bush and Mr Trump have dropped substantially in relevance in the network. But something is odd here. Let's check again:
This is how often candidates are referred to by their surname:
Transpose[{candidates,
   Total /@
    Table[Length[
      Select[sentences[[i]],
       Evaluate[
        StringContainsQ[#, candidates[[j]],
          IgnoreCase -> True] &]]], {j, 1, Length[candidates]}, {i, 1,
       Length[candidates]}]}] // TableForm
And this is how often they are referred to by their given name:
Transpose[{candidates,
   Total /@
    Table[Length[
      Select[sentences[[i]],
       Evaluate[
        StringContainsQ[#, givennames[[j]],
          IgnoreCase -> True] &]]], {j, 1, Length[candidates]}, {i, 1,
       Length[candidates]}]}] // TableForm
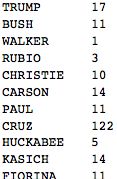
Ok, now we see that there is clearly a mistake. Why would Mr Cruz be so incredibly popular and only go by his first name? Let's check some of the sentences, that contain his name:
Select[Flatten[sentences], StringContainsQ[#, "Ted", IgnoreCase -> True] &]
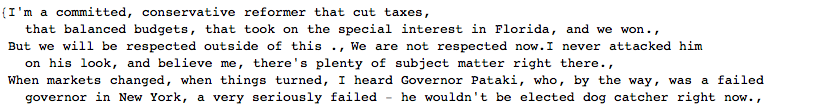
Right, so I stupidly told my program to look out for "ted" as part of words like "committed". Well, that's too bad, but can be fixed.
givennames = {" Donald", "Jeb", "Scott", "Marco", "Chris", "Ben", "Rand", " Ted ", "Mike", "John", "Carly"};
fullnames = Transpose[{givennames, candidates}];
(so I put space before and after Ted) and then again
interactionsfull =
 AdjacencyGraph[
  Transpose@
   Table[Length[
     Select[sentences[[i]],
      Evaluate[
       StringContainsQ[#, fullnames[[j]],
         IgnoreCase -> True] &]]], {j, 1, Length[candidates]}, {i, 1,
     Length[candidates]}],
  VertexLabels -> Rule @@@ Transpose[{Range[11], candidates}]]
Now again the importance of the candidates in the discussion:
Grid[Join[{{"candidate", "BetweenCentral", "Pagerank"}}, Reverse@SortBy[
    Transpose[{candidates, BetweennessCentrality[interactionsfull], PageRankCentrality[interactionsfull, 0.1]}], #[[2]] &]], Frame -> All]
and Mr. Bush is first again. Note, that in terms of self-references Mr Trump wins. A community graph of this who-references-whom network is also interesting:
CommunityGraphPlot[
 Transpose@
  Table[Length[
    Select[sentences[[i]],
     Evaluate[
      StringContainsQ[#, fullnames[[j]], IgnoreCase -> True] &]]], {j,
     1, Length[candidates]}, {i, 1, Length[candidates]}],
 VertexLabels -> Rule @@@ Transpose[{Range[11], candidates}]]
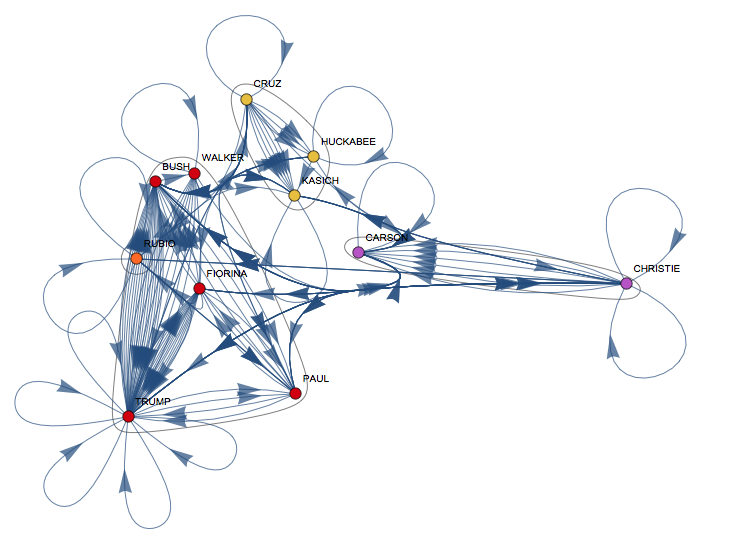
It is interesting that the reference network is quite different from Vitaliy's same-topic-graph. I think that the reference graph might be useful to understand who considers whom a direct contender: in these debates you tend to address people you have a difference of opinion rather than people you agree with, because you need to show why people need to vote for you and why you are different. It is interesting that for example Cruz, Huckabee and Kasich are a clique in my graph but are all in different cliques in Vitaliy's topic graph.
There might still be other glitches in here, and sentiment analysis is a very delicate issue anyway, so this comes with a health warning. But I hope that someone with more insight than me can make something out of this.
Cheers,
Marco


