Message Boards Message Boards

Brain data crawler and its interactive 3D Model and tree structure

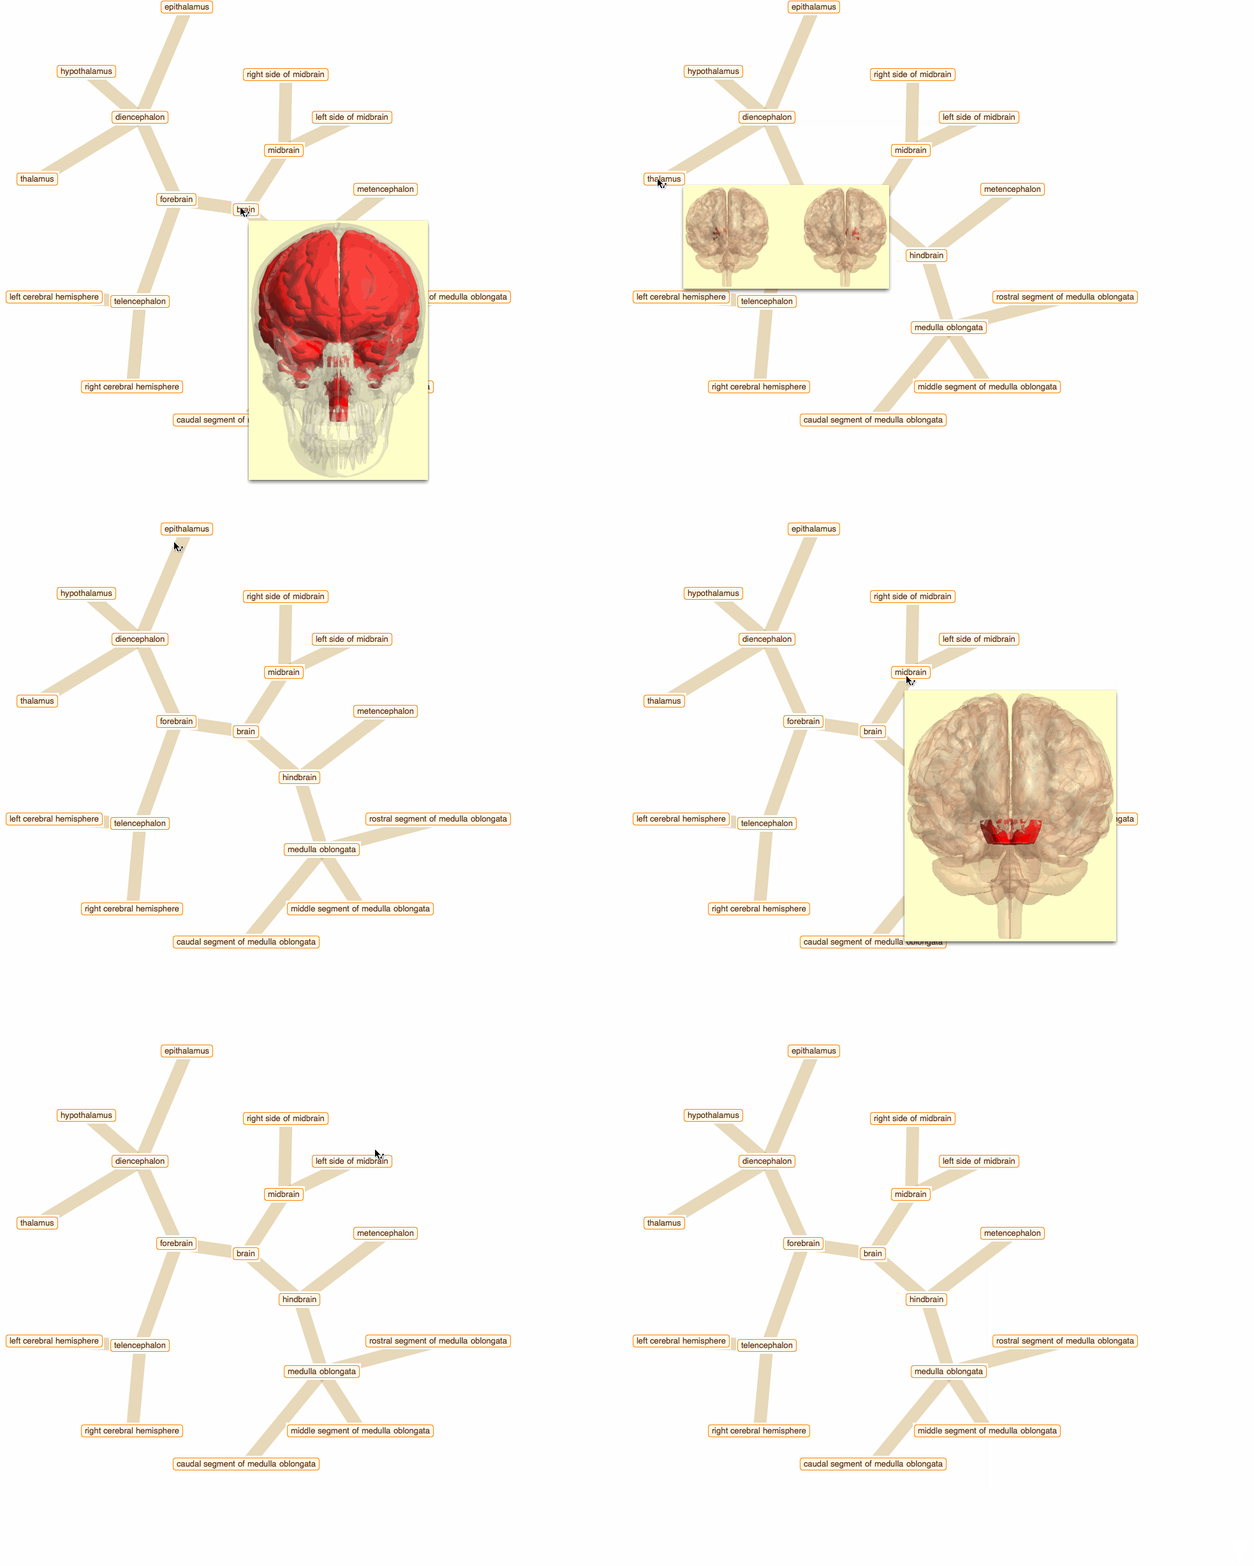
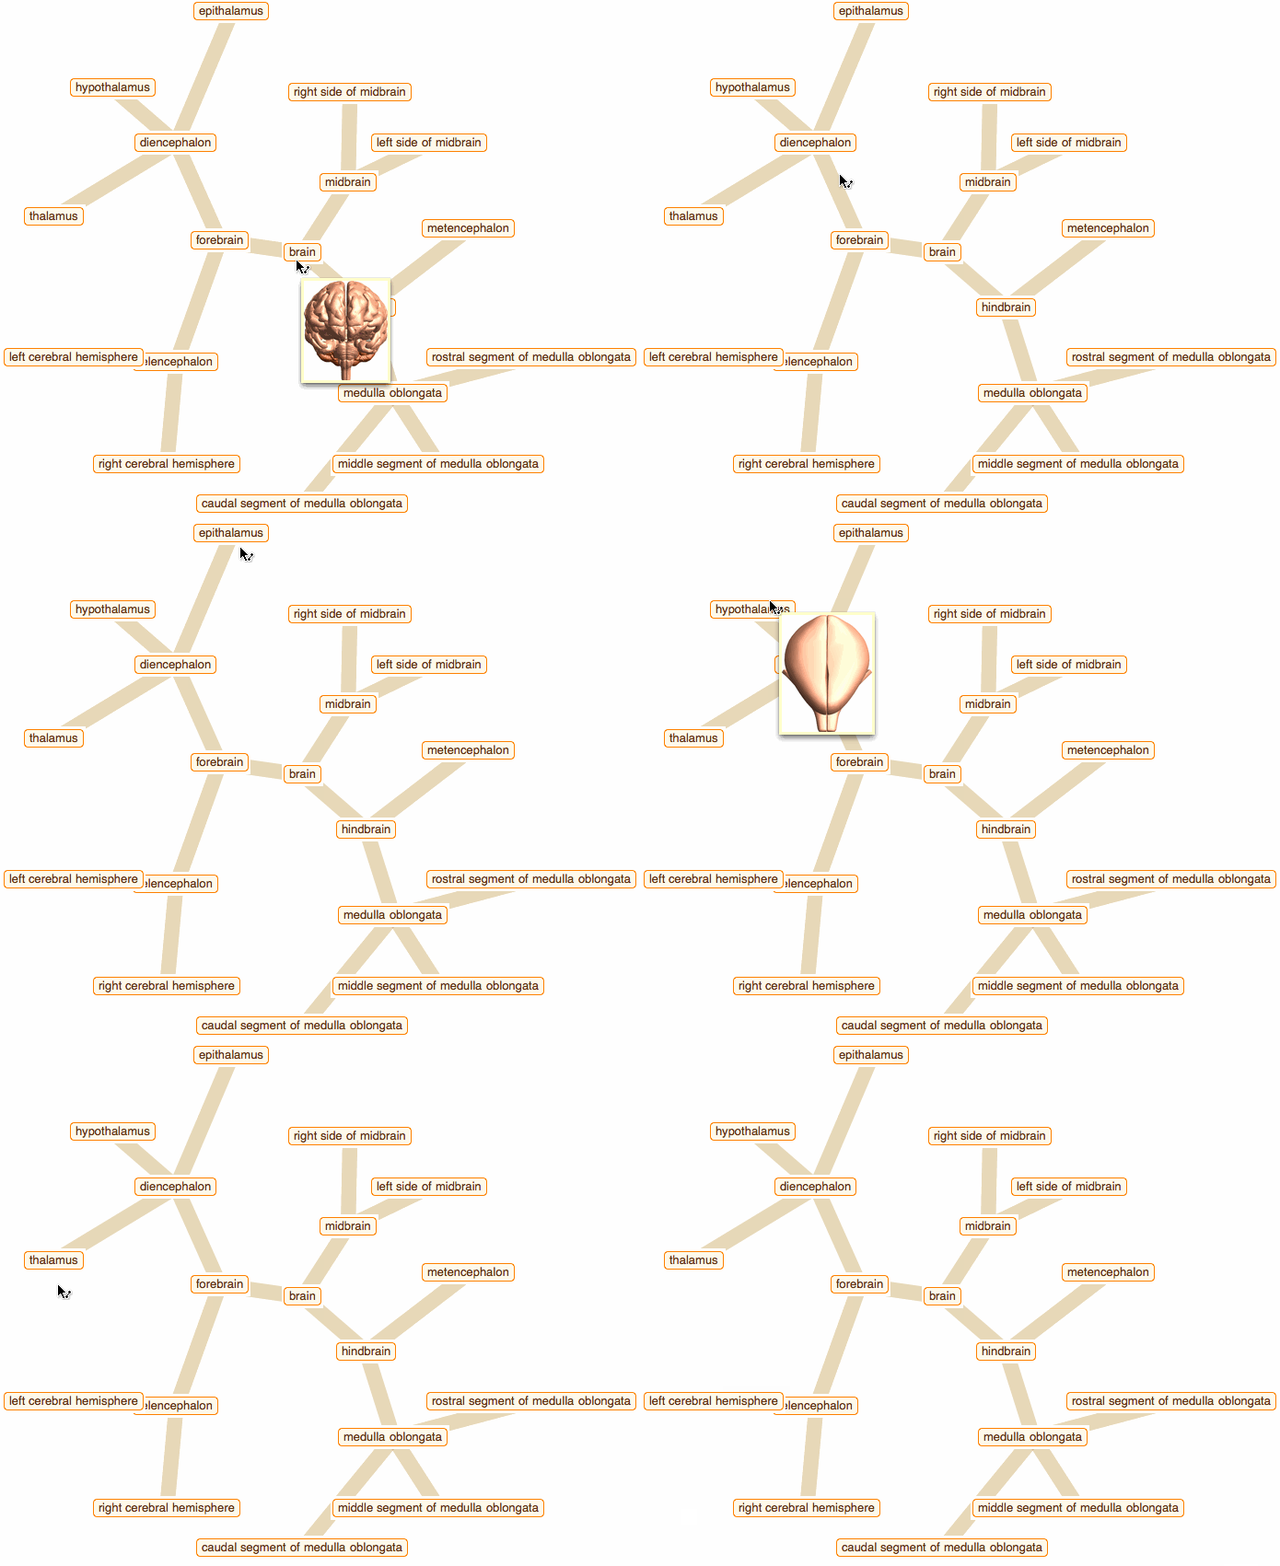
Wolfram Language has very detailed built-in data about Anatomical Structure. Here is an example of usage building an interactive models of brain. First we would need some data. Because anatomical parts constitute of smaller parts and so forth, we can visualize anatomical structures as trees, for instance:
enter image description here

To get that I need to build a data crawler:

crawler[root_, depth_] := 
  Flatten[Rest[NestList[DeleteCases[Union[Flatten[
  Thread[# -> DeleteMissing[EntityValue[#, EntityProperty["AnatomicalStructure", 
  "RegionalParts"]]]] & /@ Last /@ #]], HoldPattern[_ -> Sequence[]]] &, {"" -> root}, depth]]];

start from brain and get down 3 levels of anatomical structure:

edge = crawler[Entity["AnatomicalStructure", "Brain"], 3]

enter image description here

Get edges, vertices, and labels as images of anatomical parts:

g = Graph[edge];
vert = VertexList[g];
lblsT = Rasterize /@ vert;

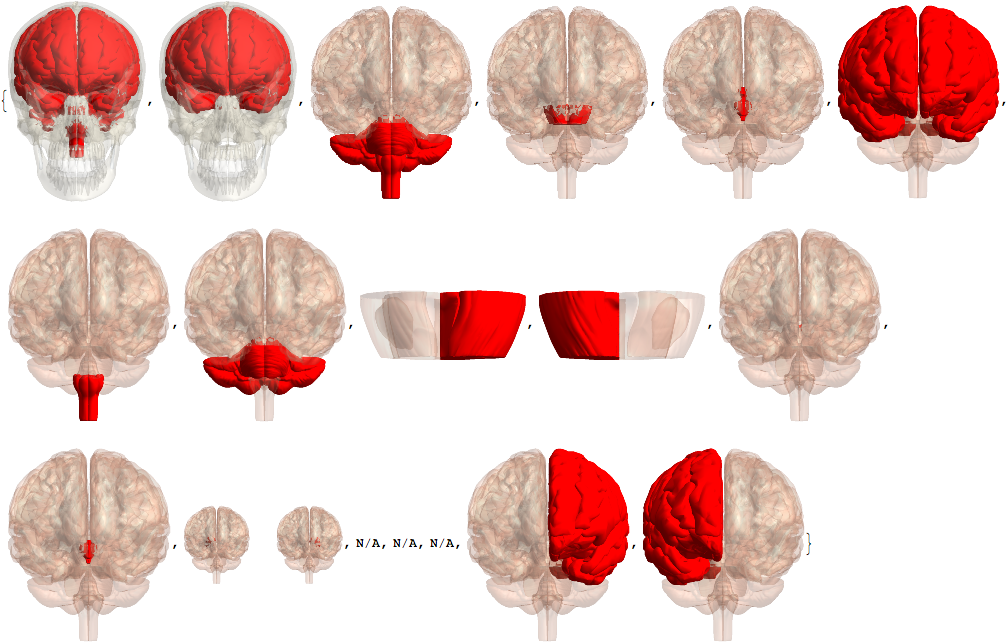
The image at the top is build with ContextualizedHighlightedImage:

lblsI = Module[{tmp},
    tmp = EntityValue[#, EntityProperty["AnatomicalStructure", "ContextualizedHighlightedImage"]];
    If[ImageQ[tmp], ImageCrop[tmp], "N/A"]] & /@ vert
enter image description here

we can also try just with Image:

lblsI = Module[{tmp},
    tmp = EntityValue[#, EntityProperty["AnatomicalStructure", "Image"]];
    If[ImageQ[tmp], ImageCrop[tmp], "N/A"]] & /@ vert

enter image description here

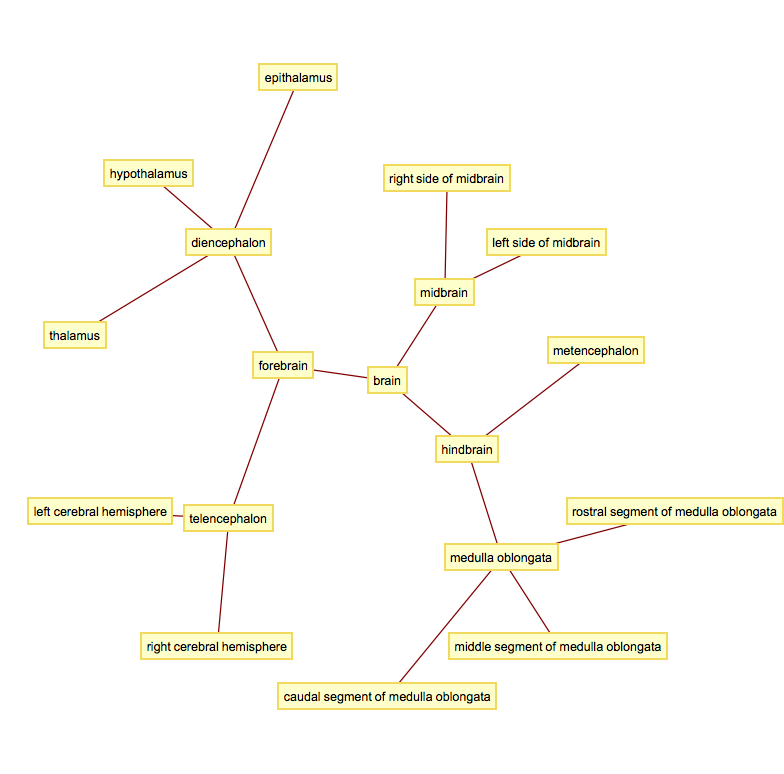
A quick way to get a non-interactive tree like plot:

GraphPlot[edge, VertexLabeling -> True]
enter image description here

But for fancy interactivity and to preserve Graph data-structure we write a short code and get the top nice image in this post:

tltps = Tooltip @@@ Transpose[{lblsT, lblsI}];

TreeGraph[vert, edge, VertexLabels -> Thread[vert -> (Placed[#, Center] & /@ tltps)], 
 ImageSize -> 700, GraphStyle -> "ThickEdge", GraphLayout -> "RadialEmbedding"] 
enter image description here

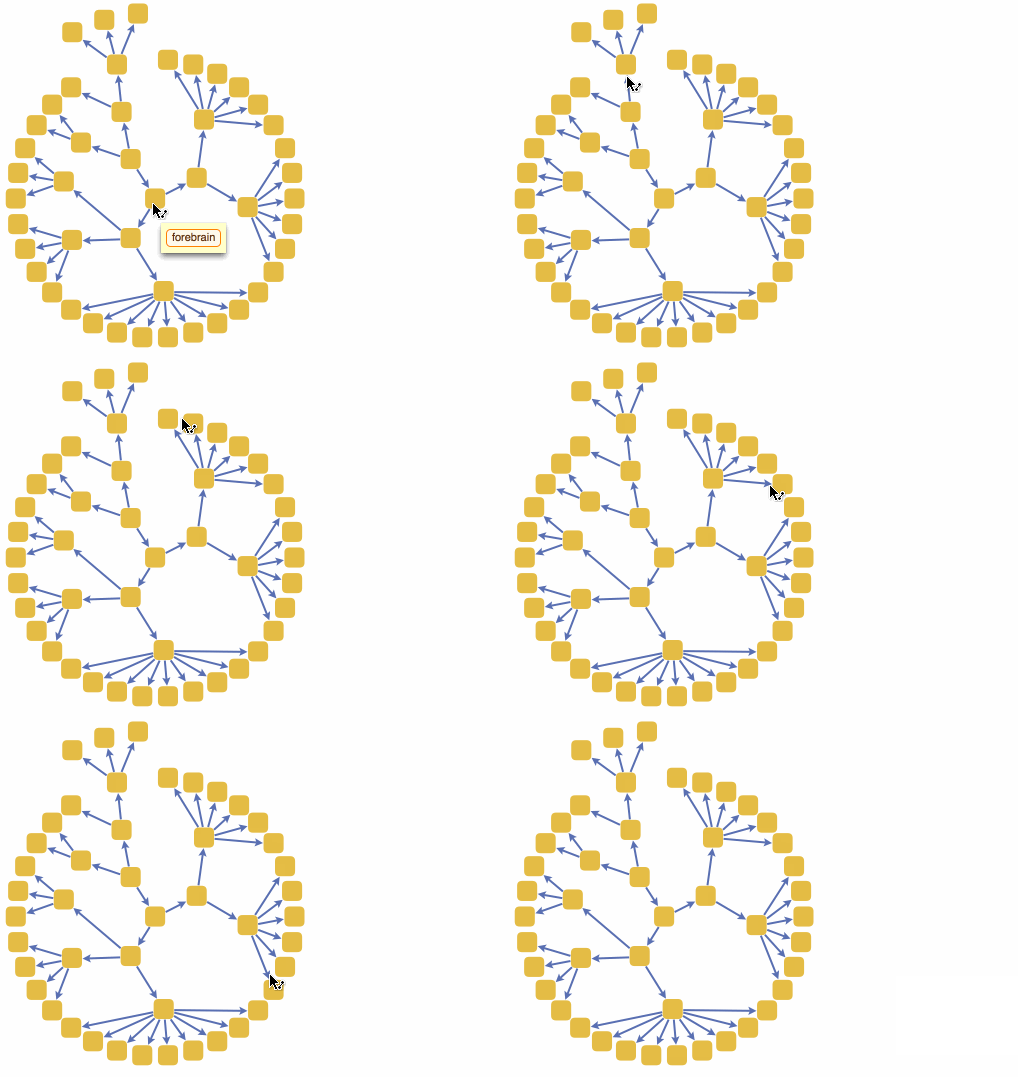
That was a good programming exercise and now we can appreciate how recent function NestGraph can make things much easier:

NestGraph[Cases[EntityValue[#, EntityProperty["AnatomicalStructure", "RegionalParts"]], _Entity] &, 
 Entity["AnatomicalStructure", "Brain"], 4, ImageSize -> 700, GraphStyle -> "SmallNetwork", 
GraphLayout -> "RadialEmbedding",  VertexLabels -> Placed["Name", Tooltip]]
enter image description here

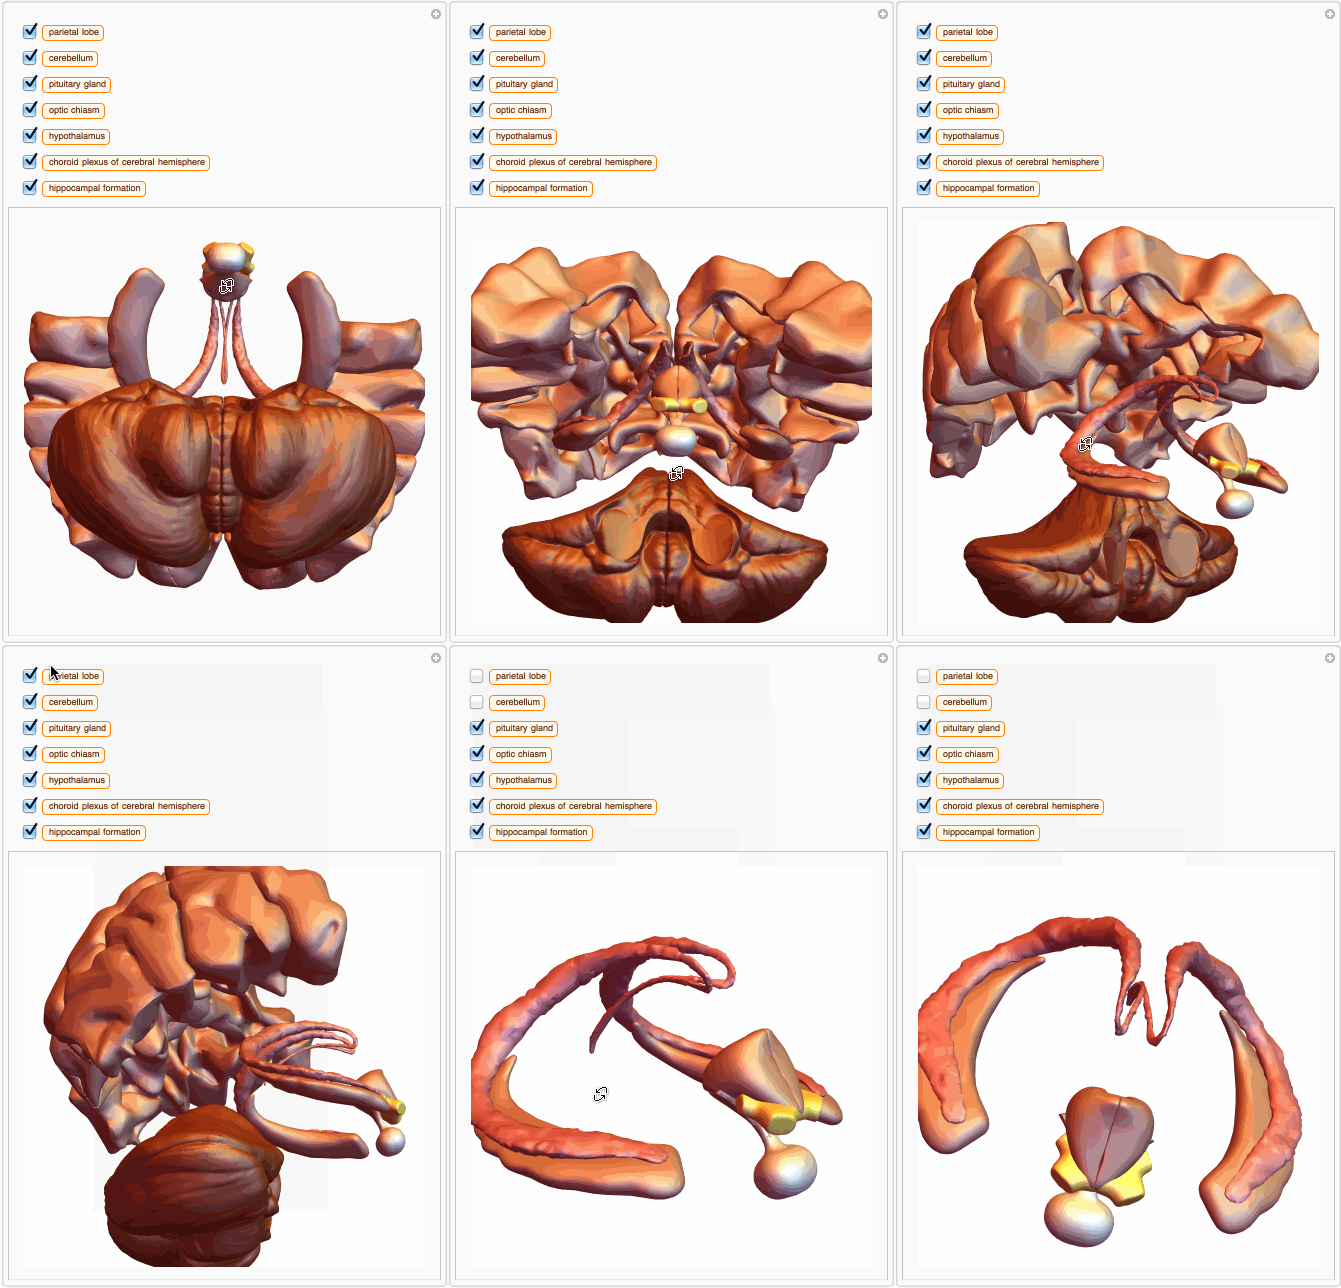
We can also build a 3D interactive model app. For example, choose specific brain parts

bParts = {
    Entity["AnatomicalStructure", "ParietalLobe"], 
    Entity["AnatomicalStructure", "Cerebellum"], 
    Entity["AnatomicalStructure", "PituitaryGland"],
    Entity["AnatomicalStructure", "OpticChiasm"], 
    Entity["AnatomicalStructure", "Hypothalamus"], 
    Entity["AnatomicalStructure", "ChoroidPlexusOfCerebralHemisphere"],
    Entity["AnatomicalStructure", "HippocampalFormation"]}

enter image description here

and get their 3D models:

bParts3D = EntityValue[bParts, EntityProperty["AnatomicalStructure", "Graphics3D"]];

And then we can build an app with just few lines of code:

Manipulate[
 Show[Graphics3D[], x, ImageSize -> {400, 400},
  SphericalRegion -> True, Boxed -> False, ViewAngle -> .27],
 {{x, bParts3D[[1]], ""}, Thread[bParts3D -> bParts],
  CheckboxBar, Appearance -> "Vertical"}]
enter image description here

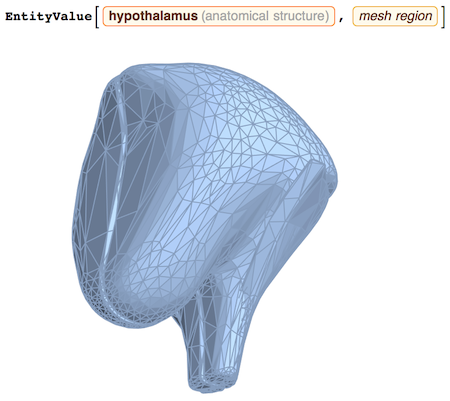
You can also get MeshRegion

enter image description here

to do some computational geometry, for example:

RegionMeasure[%]

1482.164538484

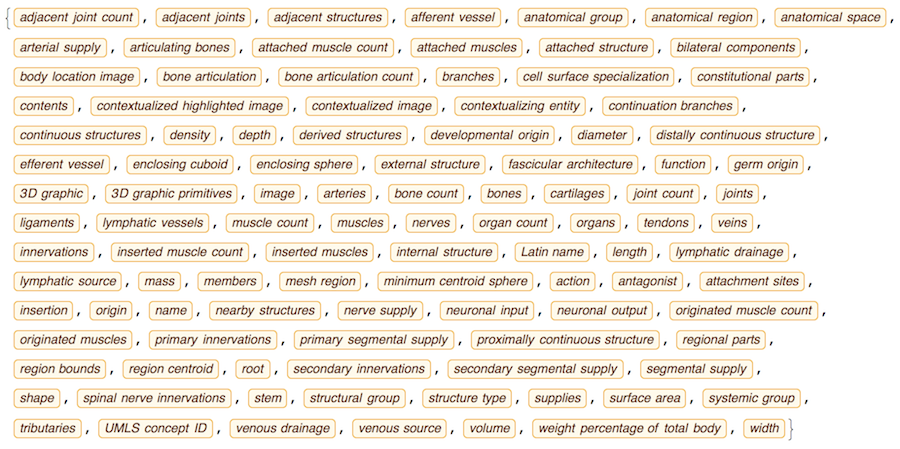
Of course you can check for any anatomical part and also its properties:

EntityProperties["AnatomicalStructure"]
enter image description here

POSTED BY: Vitaliy Kaurov
9 Replies

I didn't know these 3D models were included! Pretty cool!

POSTED BY: Sander Huisman

Yes, this could be quite useful and I had no idea it was there ...

@Vitaliy Kaurov

Thanks for this nice post. I've already used this following your code. Being motivated from this, I now want to develop a similar interactive interface for any other 3D data from the user. Can you please let me know whether this interactive interface can be developed for any other 3D data (say, for example, the knee data from http://www.osirix-viewer.com/datasets/)? If yes, please explain me how can I do so.

POSTED BY: Subhrajyoti Maji

Hi,

using the data appears to be quite straight forward. I guess that this is one of the strengths of Mathematica/the Wolfram Language. You first download the file, I have chosen this example. After unzipping it, you get a folder from which you can load the slices:

slices = Import[#] & /@ FileNames["*.dcm", "/Users/thiel/Desktop/CT2 tĂȘte, face, sinus/OS/"];

Image3D deals with the 3d reconstruction.

Image3D[slices]

enter image description here

If you click on the image you get a couple of icons. The second of which can be used to slice the 3D representation:

enter image description here

There are, of course, other colour schemes which might help to understand the data better. Try for example

Image3D[slices,ColorFunction->"XRay"]

enter image description here

Cheers,

M.

PS: Not all DICOM files on that website can be imported correctly.

POSTED BY: Marco Thiel

@ Marco Thiel

Thanks for your kind response. Yes, that's easy. However, I'm more interested in extracting different anatomical structures from the image by simply clicking on it (assuming that MorphologicalComponents correctly segments the various parts of the image) as ContextualizedHighlightedImage is used for the brain image here. It allows the user to select and highlight one component while keeping the rest transparent. Is there any way to do so for any 3D image(say, I want to highlight the teeth from the image you provided by just clicking on the teeth and make the rest transparent)?

POSTED BY: Subhrajyoti Maji

Hi @Subhrajyoti Maji ,

image segmentation is of course much more complicated, particularly if the different tissues are not very well separated by the imaging. You might want to have a look at this demonstration. I guess that you will first have to identify the individual structures. Then it should be relatively easy to use opacity to make other structures transparent. I suppose that it will involve some tweaking.

Cheers,

M.

POSTED BY: Marco Thiel

Hi @Marco Thiel,

I've done the segmentation (http://mathematica.stackexchange.com/questions/112983/how-to-create-separate-views-for-3d-input-and-output-images-graphics) for my images and the morphological components can be identified well. Now I want to design the interface such that the user can choose any component by just clicking on it. The 2D version of it can be found here(http://mathematica.stackexchange.com/questions/35327/selecting-morphological-components-by-clicking-on-them?lq=1). Another problem with this is that it shows images as a list. However, I want them to be shown in the way as given here(http://demonstrations.wolfram.com/PhasesOfPlanets/) (consider the interface only to display the output images along with the manipulations like rotation, translation, view, zoom etc.)

POSTED BY: Subhrajyoti Maji
Posted 8 years ago

Really nice visualisation! I tried rerunning your code for the heart (Entity["AnatomicalStructure", "Heart"]) and found that EntityProperty["AnatomicalStructure", "ContextualizedHighlightedImage"] returns "N/A" for all parts,

enter image description here

whereas EntityProperty["AnatomicalStructure", "RegionalLocationHighlightedImage"] works well.

enter image description here

POSTED BY: Martins Dogo

enter image description here -- you have earned Featured Contributor Badge enter image description here Your exceptional post has been selected for our editorial column Staff Picks http://wolfr.am/StaffPicks and Your Profile is now distinguished by a Featured Contributor Badge and is displayed on the Featured Contributor Board. Thank you!

POSTED BY: EDITORIAL BOARD
Reply to this discussion
Community posts can be styled and formatted using the Markdown syntax.
Reply Preview
Attachments
Remove
or Discard

Group Abstract Group Abstract