Group Abstract Group Abstract

Message Boards Message Boards

Determine the equilibrium points of a predator-prey model?

Posted 9 years ago

Hi I am trying to determine the equilibrium points in terms of the nondimensional parameters. the following is the non dimensionalised system:

f[u_, v_] := u (1 - u + (-1 + E^(-u \[Alpha])) v)
g[u_, v_] := v (\[Beta] - E^(-u \[Alpha]) \[Beta] - \[Gamma])

I used the following codes to determine the equilibrium points :

equilibrio = Solve[{f[u, v] == 0, g[u, v] == 0}, {u, v}]

And i get the following error:

'' This system cannot be solved with the methods available to Solve. ''

how can i get the equilibrium points? Please leave your thoughts Thanks Jo

6 Replies

Hi,

it appears that NSolve does a good job:

f[u, v] := u (1 - u + (-1 + E^(-u \[Alpha])) v);
g[u, v] := v (\[Beta] - E^(-u \[Alpha]) \[Beta] - \[CapitalGamma]);
NSolve[{f[u, v] == 0, g[u, v] == 0}, {u, v}, Reals]

gives

enter image description here

Cheers,

M.

POSTED BY: Marco Thiel

I'm getting errors when I try to evaluate both your Manipulate expressions. For he first:

Part::take: Cannot take positions 1 through 3 in sols. >>
ReplaceAll::reps: {sols[[1;;3]]} is neither a list of replacement rules nor a valid dispatch table, and so cannot be used for replacing. >>

etc.

For the second:

Select::normal: Nonatomic expression expected at position 1 in Select[sols,!MemberQ[#1[[All,2]],Undefined]&]. >>
ReplaceAll::reps: {sols} is neither a list of replacement rules nor a valid dispatch table, and so cannot be used for replacing. >>
ReplaceAll::reps: {!MemberQ[#1[[All,2]],Undefined]&} is neither a list of replacement rules nor a valid dispatch table, and so cannot be used for replacing. >>

etc.

POSTED BY: Murray Eisenberg

Thanks a lot. I am trying to do now the streamplot the method different to you have done and I will comapre with your streamplot. thanks again Jopaul

You might also like this:

Manipulate[
 VectorPlot[{u (1 - u + (-1 + E^(-u \[Alpha]1)) v),  v (\[Beta]1 - E^(-u \[Alpha]1) \[Beta]1 - \[CapitalGamma]1)}, {v, -5, 
   5}, {u, -5, 5}, StreamPoints -> 40, Epilog -> {Red, PointSize[0.02], Point[Evaluate[
      Select[{v, u} /. (sols[[1 ;; 3]] /. {\[Alpha] -> \[Alpha]1, \[Beta] ->  \[Beta]1, \[CapitalGamma] -> \[CapitalGamma]1}), !MemberQ[#, Undefined] &]]]}], {{\[Alpha]1, 0.795}, 0, 2}, {{\[Beta]1, 1.79}, 0, 2}, {{\[CapitalGamma]1, 1.315}, 0, 3}]

enter image description here

Cheers,

M.

PS: This modified version also plots the null-clines and indicates the stability of the fixed points.

Manipulate[
 colors = (Which[(Re[#[[1]]] == 0 && Re[#[[2]]] == 0), Blue, (Re[#[[1]]] < 0 && Re[#[[2]]] < 0), 
              Green, (Re[#[[1]]] > 0 && Re[#[[2]]] > 0), Red, True, Orange] & @
                Eigenvalues[D[{u (1 - u + (-1 + E^(-u \[Alpha])) v), v (\[Beta] - E^(-u \[Alpha]) \[Beta] - \[CapitalGamma])}, {{v, u}}] /. # /. {\[Alpha] -> \[Alpha]1, \[Beta] ->  \[Beta]1, \[CapitalGamma] -> \[CapitalGamma]1}]) & /@ (Select[ (sols \
/. {\[Alpha] -> \[Alpha]1, \[Beta] ->  \[Beta]1, \[CapitalGamma] -> \[CapitalGamma]1}), ! MemberQ[#[[All, 2]], Undefined] &]); 
Show[VectorPlot[{u (1 - u + (-1 + E^(-u \[Alpha]1)) v), v (\[Beta]1 - E^(-u \[Alpha]1) \[Beta]1 - \[CapitalGamma]1)}, {v, -5, 5}, {u, -5, 5}, StreamPoints -> 40, 
   Epilog -> Flatten@{PointSize[0.02], Red, {#[[1]], Point[#[[2]]]} & /@ Transpose[{colors, (Select[{v, u} /. (sols /. {\[Alpha] -> \[Alpha]1, \[Beta] ->  \[Beta]1, \[CapitalGamma] -> \[CapitalGamma]1}), !MemberQ[#, Undefined] &])}]}], ContourPlot[{u (1 - u + (-1 + E^(-u \[Alpha]1)) v) == 0, 
    v (\[Beta]1 - E^(-u \[Alpha]1) \[Beta]1 - \[CapitalGamma]1) == 0}, {v, -5, 5}, {u, -5, 5}, PlotPoints -> 30]], {{\[Alpha]1, 0.795}, 0, 2}, {{\[Beta]1, 1.79}, 0, 
  2}, {{\[CapitalGamma]1, 1.315}, 0, 3}]

enter image description here

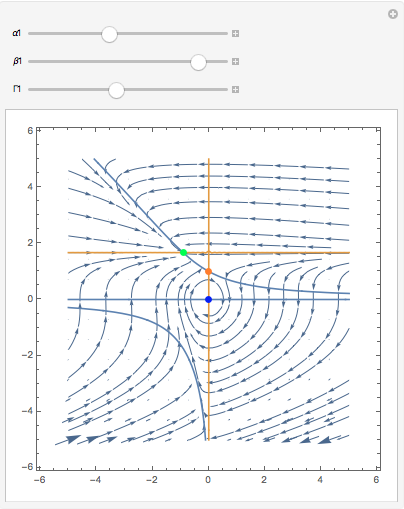
It is not very elegant in terms of the programming, but does the trick. Blue indicates non-hyperbolicity - so we cannot determine the stability using linearisation. Green is stable, orange is a saddle, and red would be unstable in both eigen-directions. Null-clines for the x-direction are in blue and for the y-direction in yellow/gold. Fixed points are where null-clines "of different colour" meet. You will see that in the code I calculate the Jacobian Matrix and evaluate at the fixed points. That means that the program calculates the eigenvalues, that - using the Hartman-Grobman theorem- determine the stability of hyperbolic fixed points.

I hope I haven't made a typo somewhere in the code...

POSTED BY: Marco Thiel

You do know that the definition of a function uses the form f[u,v]:= . . . Write g[u,v]:= . . . on a separate line. Also parentheses are not matching.

POSTED BY: S M Blinder
Reply to this discussion
Community posts can be styled and formatted using the Markdown syntax.
Reply Preview
Attachments
Remove
or Discard