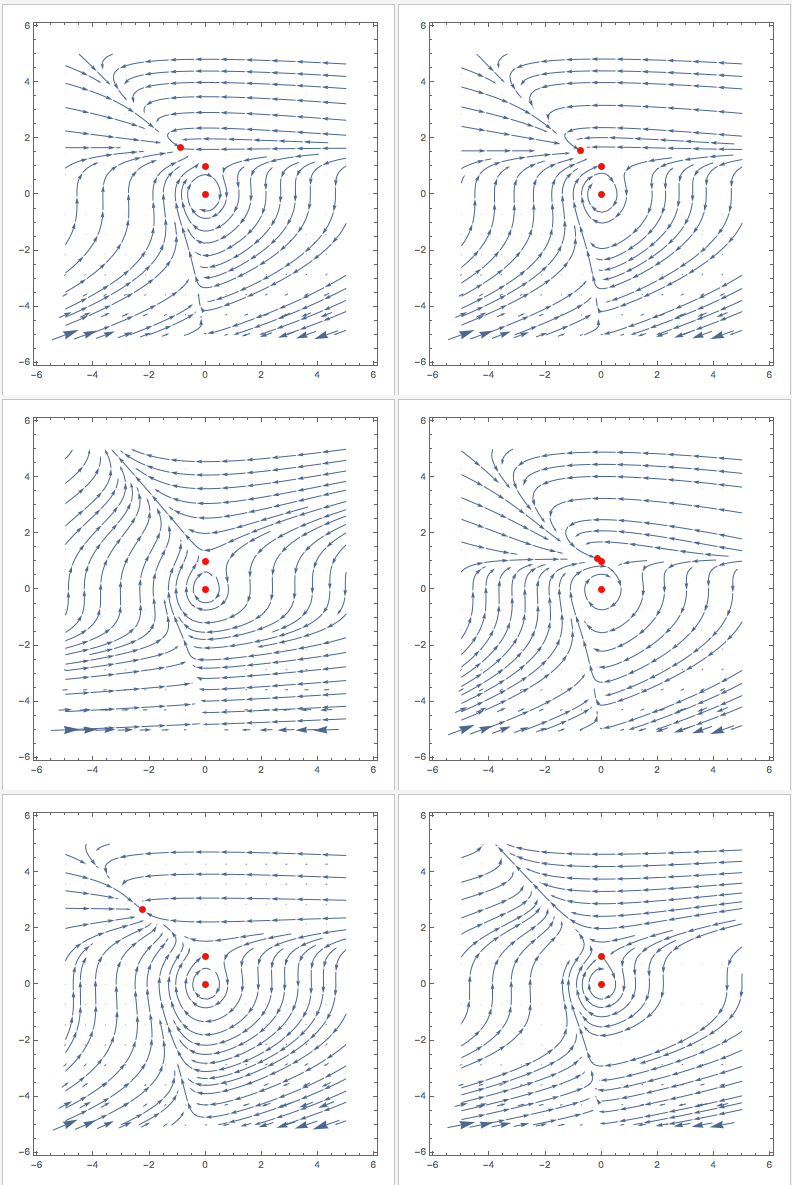
You might also like this:
Manipulate[
 VectorPlot[{u (1 - u + (-1 + E^(-u \[Alpha]1)) v),  v (\[Beta]1 - E^(-u \[Alpha]1) \[Beta]1 - \[CapitalGamma]1)}, {v, -5,
   5}, {u, -5, 5}, StreamPoints -> 40, Epilog -> {Red, PointSize[0.02], Point[Evaluate[
      Select[{v, u} /. (sols[[1 ;; 3]] /. {\[Alpha] -> \[Alpha]1, \[Beta] ->  \[Beta]1, \[CapitalGamma] -> \[CapitalGamma]1}), !MemberQ[#, Undefined] &]]]}], {{\[Alpha]1, 0.795}, 0, 2}, {{\[Beta]1, 1.79}, 0, 2}, {{\[CapitalGamma]1, 1.315}, 0, 3}]

Cheers,
M.
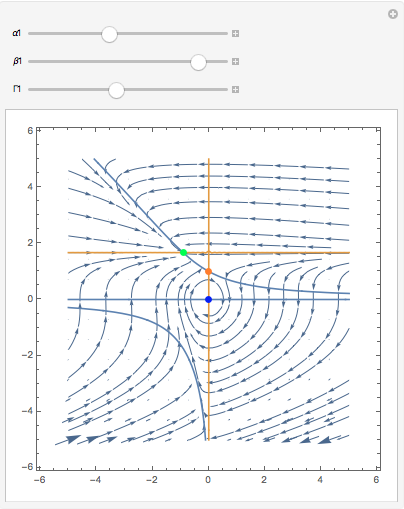
PS: This modified version also plots the null-clines and indicates the stability of the fixed points.
Manipulate[
 colors = (Which[(Re[#[[1]]] == 0 && Re[#[[2]]] == 0), Blue, (Re[#[[1]]] < 0 && Re[#[[2]]] < 0),
              Green, (Re[#[[1]]] > 0 && Re[#[[2]]] > 0), Red, True, Orange] & @
                Eigenvalues[D[{u (1 - u + (-1 + E^(-u \[Alpha])) v), v (\[Beta] - E^(-u \[Alpha]) \[Beta] - \[CapitalGamma])}, {{v, u}}] /. # /. {\[Alpha] -> \[Alpha]1, \[Beta] ->  \[Beta]1, \[CapitalGamma] -> \[CapitalGamma]1}]) & /@ (Select[ (sols \
/. {\[Alpha] -> \[Alpha]1, \[Beta] ->  \[Beta]1, \[CapitalGamma] -> \[CapitalGamma]1}), ! MemberQ[#[[All, 2]], Undefined] &]);
Show[VectorPlot[{u (1 - u + (-1 + E^(-u \[Alpha]1)) v), v (\[Beta]1 - E^(-u \[Alpha]1) \[Beta]1 - \[CapitalGamma]1)}, {v, -5, 5}, {u, -5, 5}, StreamPoints -> 40,
   Epilog -> Flatten@{PointSize[0.02], Red, {#[[1]], Point[#[[2]]]} & /@ Transpose[{colors, (Select[{v, u} /. (sols /. {\[Alpha] -> \[Alpha]1, \[Beta] ->  \[Beta]1, \[CapitalGamma] -> \[CapitalGamma]1}), !MemberQ[#, Undefined] &])}]}], ContourPlot[{u (1 - u + (-1 + E^(-u \[Alpha]1)) v) == 0,
    v (\[Beta]1 - E^(-u \[Alpha]1) \[Beta]1 - \[CapitalGamma]1) == 0}, {v, -5, 5}, {u, -5, 5}, PlotPoints -> 30]], {{\[Alpha]1, 0.795}, 0, 2}, {{\[Beta]1, 1.79}, 0,
  2}, {{\[CapitalGamma]1, 1.315}, 0, 3}]

It is not very elegant in terms of the programming, but does the trick. Blue indicates non-hyperbolicity - so we cannot determine the stability using linearisation. Green is stable, orange is a saddle, and red would be unstable in both eigen-directions. Null-clines for the x-direction are in blue and for the y-direction in yellow/gold. Fixed points are where null-clines "of different colour" meet. You will see that in the code I calculate the Jacobian Matrix and evaluate at the fixed points. That means that the program calculates the eigenvalues, that - using the Hartman-Grobman theorem- determine the stability of hyperbolic fixed points.
I hope I haven't made a typo somewhere in the code...