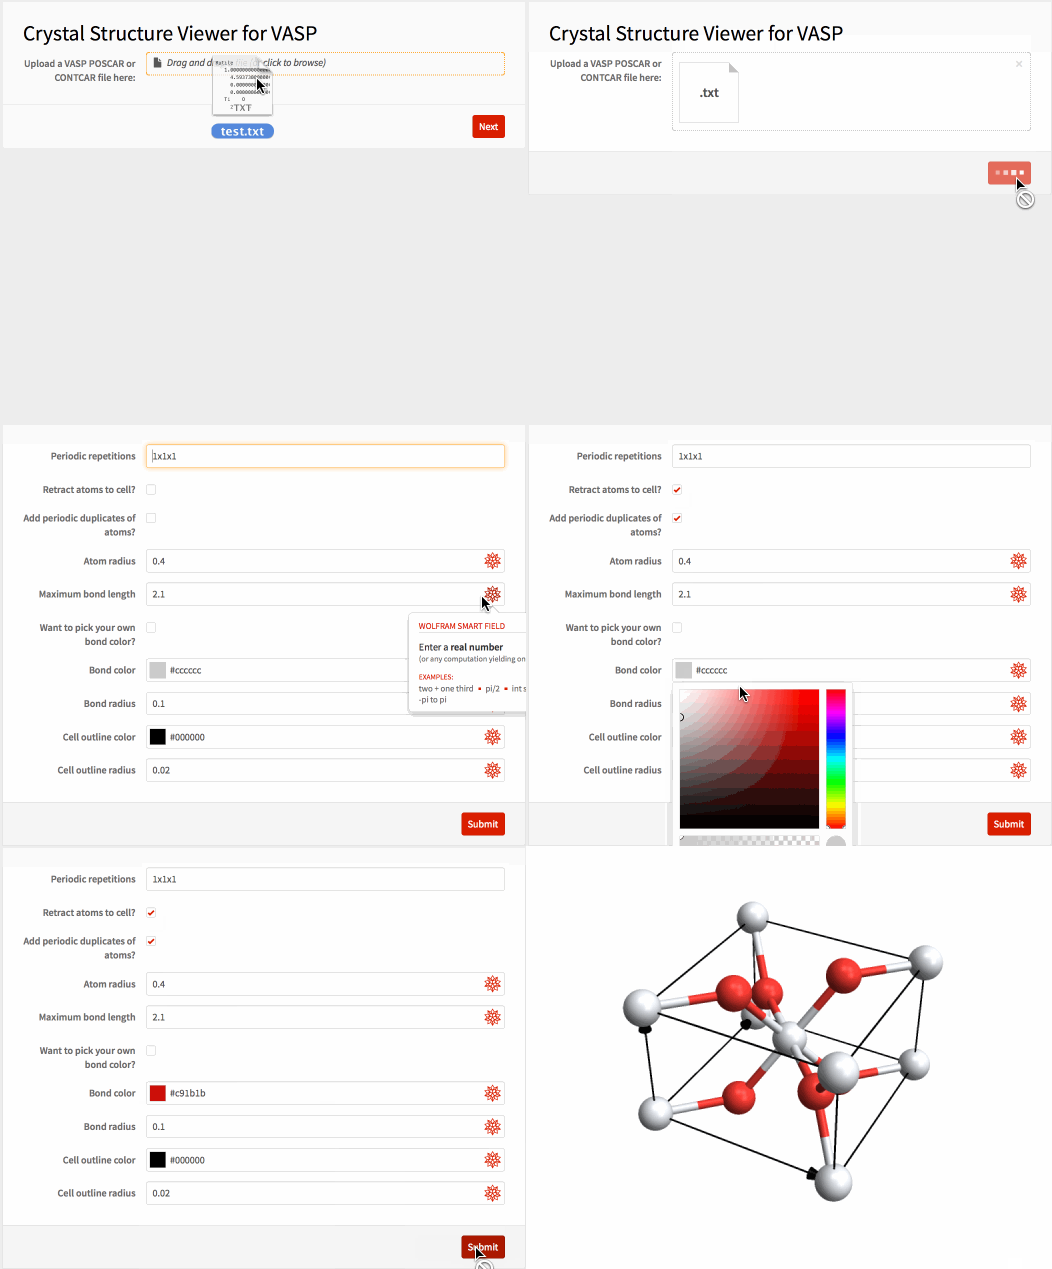
You may remember that I've already posted packages for crystal structure plots. I just wanted to dump a piece of code here that's based on these packages and will let you plot crystal structures from VASP input/output files on a webpage... in case anyone else is using VASP.
For anyone who wants to try the app but doesn't have a VASP file handy, here's a sample you can copy and paste into a plain text file:
Rutile
   1.00000000000000
     4.5937300000000000    0.0000000000000000    0.0000000000000000
     0.0000000000000000    4.5937300000000000    0.0000000000000000
     0.0000000000000000    0.0000000000000000    2.9581200000000000
   Ti    O
     2     4
Direct
  0.0000000000000000  0.0000000000000000  0.0000000000000000
  0.5000000000000000  0.5000000000000000  0.5000000000000000
  0.3053000000000000  0.3053000000000000  0.0000000000000000
  0.6947000000000000  0.6947000000000000  0.0000000000000000
  0.8053000000000000  0.1947000000000000  0.5000000000000000
  0.1947000000000000  0.8053000000000000  0.5000000000000000
The actual code is below the image. Have fun!

CloudDeploy[FormFunction[{
   {{"file", "Upload a VASP POSCAR or CONTCAR file here:"} -> <|
      "Interpreter" -> "UploadedFile"|>}, {
    {"sysdim", "Periodic repetitions"} -> <|
      "Interpreter" ->
       Restricted[
        DelimitedSequence["Integer",
         " " | "," | ";" | "/" | "x" | "X"], 3], "Input" -> "1x1x1"|>,
    {"retractq", "Retract atoms to cell?"} -> <|
      "Interpreter" -> "Boolean", "Input" -> False|>,
    {"addq", "Add periodic duplicates of atoms?"} -> <|
      "Interpreter" -> "Boolean", "Input" -> False|>,
    {"atomrad", "Atom radius"} -> <|"Interpreter" -> "ComputedReal",
      "Input" -> 0.4|>,
    {"bonddist", "Maximum bond length"} -> <|
      "Interpreter" -> "ComputedReal", "Input" -> 2.1|>,
    {"monobond", "Want to pick your own bond color?"} -> <|
      "Interpreter" -> "Boolean", "Input" -> False|>,
    {"bondcol", "Bond color"} -> <|"Interpreter" -> "ComputedColor",
      "Input" -> GrayLevel[.8]|>,
    {"bondrad", "Bond radius"} -> <|"Interpreter" -> "ComputedReal",
      "Input" -> 0.1|>,
    {"linecol", "Cell outline color"} -> <|
      "Interpreter" -> "ComputedColor", "Input" -> Black|>,
    {"linerad", "Cell outline radius"} -> <|
      "Interpreter" -> "ComputedReal", "Input" -> 0.02|>
    }},

  Module[{file, sysdim, retractq, addq, atomrad, bonddist, monobond,
     bondcol, bondrad, linecol, linerad,
     data, speciesQ, atomcol, chemoffset, chgoffset, lattscale,
     lattvec, coord, conf, coordP, confP, new, tubearrow, lines,
     atoms, tuples, bonds},

    file = #file;
    sysdim = #sysdim;
    retractq = #retractq;
    addq = #addq;
    atomrad = #atomrad;
    bonddist = #bonddist;
    monobond = #monobond;
    bondcol = #bondcol;
    bondrad = #bondrad;
    linecol = #linecol;
    linerad = #linerad;

    (*import: *)
    data = Import[file, "Table"];
    (*offset if chemical species are given: *)
    speciesQ = MatchQ[data[[6]], {_String ..}];
    atomcol[type_] :=
     If[speciesQ, ColorData["Atoms", data[[6, type]]],
      ColorData[97, type]];
    chemoffset = If[speciesQ, 1, 0];
    (*offset for missing "Selective Dynamics" line as is common in \
CHG/CHGCAR: *)
    chgoffset =
     If[TrueQ[Length[data[[chemoffset + 8]]] > 0] &&
       MatchQ[data[[chemoffset + 8, 1]], _?NumericQ], -1, 0];

    (*lattice vectors and atoms: *)
    lattvec = data[[3 ;; 5]];
    lattscale = data[[2]];
    If[TrueQ[Length[lattscale] == 1], lattscale = lattscale[[1]]];
    If[TrueQ[Sign[lattscale] == -1],
     lattscale = (-lattscale/Det[lattvec])^(1/3)];
    lattvec =
     If[TrueQ[Length[lattscale] == 3],
      N[lattscale[[#]]*lattvec[[#]]] & /@ Range[3],
      N[lattscale*lattvec]];
    conf =
     Flatten[Join[
       ConstantArray[#, data[[chemoffset + 6, #]]] & /@
        Range[Length[data[[chemoffset + 6]]]]]];
    coord =
     N[data[[chemoffset + chgoffset +
          9 ;; (chemoffset + chgoffset + 8 +
           Total[data[[chemoffset + 6]]]), 1 ;; 3]]];

    (*reprojection for cartesian coordinates: *)
    If[TrueQ[Length[data[[chemoffset + chgoffset + 8]]] > 0] &&
      StringMatchQ[ToString[data[[chemoffset + chgoffset + 8, 1]]],
       "c*" | "k*", IgnoreCase -> True],
     If[TrueQ[Length[lattscale] == 3], coord = #*lattscale & /@ coord,
       coord = coord*lattscale];
     coord = coord.Inverse[lattvec]];
    {coordP, confP} = {coord, conf};

    (*retraction, moving all atoms back into the cell: *)
    If[retractq, With[{retracttol = 10^-4},
      coordP =
       Partition[
        If[# > (1 - retracttol), # - 1, #] & /@
         Flatten[# - Floor[#] & /@ coordP], 3];
      new = DeleteDuplicates[Transpose[{coordP, confP}],
        (Norm[
             Round[#1[[1]], retracttol] - Round[#2[[1]], retracttol] -
               Floor[Round[#1[[1]], retracttol]] +
              Floor[Round[#2[[1]], retracttol]]] <
            retracttol) && (#1[[2]] == #2[[2]]) &];
      {coordP, confP} = Transpose[new]]];

    (*periodic repetition: *)
    coordP =
     Flatten[Table[(# + {a, b, c}) & /@ coordP, {a, 0,
        sysdim[[1]] - 1}, {b, 0, sysdim[[2]] - 1}, {c, 0,
        sysdim[[3]] - 1}], 3];
    confP = Flatten[ConstantArray[confP, Times @@ sysdim]];

    (*add peridic duplicates if desired: *)
    If[TrueQ[addq],
     new = Transpose[{coordP, confP}];
     new =
      Join[new, # + {{sysdim[[1]], 0, 0}, 0} & /@
        Select[new,
         Abs[#[[1, 1]]] < 0.01 &], # + {{-sysdim[[1]], 0, 0}, 0} & /@
        Select[new, Abs[#[[1, 1]]] > 0.99*sysdim[[1]] &]];
     new =
      Join[new, # + {{0, sysdim[[2]], 0}, 0} & /@
        Select[new,
         Abs[#[[1, 2]]] < 0.01 &], # + {{0, -sysdim[[2]], 0}, 0} & /@
        Select[new, Abs[#[[1, 2]]] > 0.99*sysdim[[2]] &]];
     new =
      Join[new, # + {{0, 0, sysdim[[3]]}, 0} & /@
        Select[new,
         Abs[#[[1, 3]]] < 0.01 &], # + {{0, 0, -sysdim[[3]]}, 0} & /@
        Select[new, Abs[#[[1, 3]]] > 0.99*sysdim[[3]] &]];
     {coordP, confP} = Transpose[new];
     ];

    (*cell lines: *)
    tubearrow[{tail_, head_}] :=
     With[{scale = .5*Sqrt[Mean[Norm /@ lattvec]*linerad]},
      Tube[{tail, head - 4*scale*Normalize[head - tail],
        head - 4*scale*Normalize[head - tail], head}, {linerad,
        linerad, scale, 0}]];
    lines = {linecol, Tube[#.lattvec, linerad] & /@ {
        {{0, 0, #}, {1, 0, #}, {1, 1, #}, {0, 1, #}, {0,
            0, #}} & /@ {0, 1},
        {{0, 0, #} & /@ {0, 1}, {1, 0, #} & /@ {0,
           1}, {1, 1, #} & /@ {0, 1}, {0, 1, #} & /@ {0, 1}}
        }, tubearrow[{{0, 0, 0}, #}] & /@ lattvec};

    (*atoms: *)
    atoms =
     Tooltip[{atomcol[confP[[#]]],
         Sphere[coordP[[#]].lattvec, atomrad]}, #] & /@
      Range[Length[confP]];

    (*bonds: *)
    tuples =
     Select[Subsets[Range[Length[confP]], {2}],
      Norm[(coordP[[#]].lattvec)[[1]] - (coordP[[#]].lattvec)[[2]]] <
        bonddist &];
    bonds = If[TrueQ[tuples == {}], {},
      If[monobond,
         {bondcol, Tube[coordP[[#]].lattvec, bondrad]},
         Table[{atomcol[confP[[#[[ii]]]]],
           Tube[{coordP[[#[[ii]]]].lattvec,
             Total[coordP[[#]].lattvec]*.5}, bondrad]}, {ii, 1, 2}]
         ] & /@ tuples];

    (*return the plot: *)
    Graphics3D[{lines, bonds, atoms}, ImageSize -> Large,
     BaseStyle -> {Specularity[Gray, 100]}, Boxed -> False,
     SphericalRegion -> True, Lighting -> "Neutral"]
    ]
   &, "PNG",
  AppearanceRules -> <|
    "Title" -> "Crystal Structure Viewer for VASP"|>],
 Permissions -> "Public"]