Note: In this post I will show how to create the following visualization.
Today, 1st of June, there has been a shooting at the University of California. Sadly, mass shootings seem quite frequent in the US. With this in mind, I will try to visualize the US Mass Shootings in 2016 using the Wolfram Language.
First, we need to import into Mathematica a dataset with all the mass shootings so far. We can find such a dataset, for example, in the website: http://www.gunviolencearchive.org/. There you can export as CSV a dataset with all mass shooting in 2016. Then, saving the file into the same folder as my notebook, I can easily import the data:
SetDirectory[NotebookDirectory[]];
dataset = Import["export-4b556202-9b81-4989-b67f-dd70bce40889.csv", "CSV"];
This dataset contains the following information:
dataset[[1, 1 ;; 7]]
{"Incident Date", "State", "City Or County", "Address", "# Killed", \ "# Injured", "Operations"}
It is straightforward to get the GeoPositions of the shooting by using Interpreter["Location"] :
locations = Interpreter["Location"][dataset[[2 ;; All, 3]]]
There are a couple of locations that Interpreter fails to identify. I can get rid of them using Cases and obtain a list of the number of killed people per shooting along their locations:
dataKilled = Cases[Transpose[{dataset[[2 ;; All, 5]], locations}], {_, _GeoPosition}]
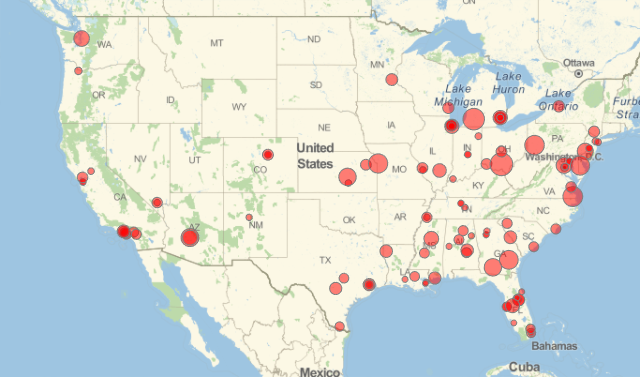
Now, I can create a map of the US with the disks centered in the shootings locations and with radius proportional to the number of killed people:
GeoGraphics[
{GeoStyling[Directive[Opacity[0.5], Red], EdgeForm[Gray]], GeoDisk[#2, 4 10^4 Log[2 + #1]]} & @@@ dataKilled,
GeoRange -> {{22, 50}, {-130, -70}}, GeoProjection -> "Mercator", ImageSize -> 640]
The same for injured people:
dataInjured = Cases[Transpose[{dataset[[2 ;; All, 6]], locations}], {_, _GeoPosition}]
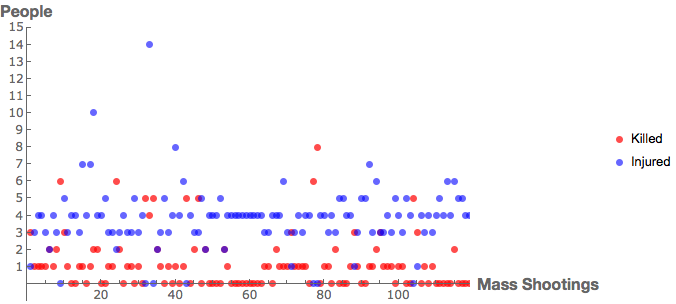
Apart of the maps, I would also like to create a ListPlot with the exact number of victims and the number of shootings along the date that occurred. I can get the dates in a chronological order with:
Reverse[dataset[[2 ;; All, 1]]]
And the ListPlot looks like:
ListPlot[{Reverse[dataKilled][[1 ;; All, 1]], Reverse[dataInjured][[1 ;; All, 1]]}, PlotRange -> {{0, Length[dataInjured]}, {-1, 15}},
AxesLabel -> {Style["Mass Shootings", Bold, FontFamily -> "Helvetica Neue", FontSize -> 16],
Style["People", FontFamily -> "Helvetica Neue", Bold, FontSize -> 16]}, PlotLegends -> {"Killed", "Injured"},
PlotStyle -> {Directive[{Red}, Opacity[0.7], PointSize[Large]], Directive[{Blue}, Opacity[0.6], PointSize[Large]]},
ImageSize -> 600, Ticks -> {Automatic, Range[15]}, TicksStyle -> Directive["Label", 12]]
Finally I can obtain the animation showed at the beginning of the post with the following Manipulate:
Manipulate[Labeled[Style[
   Grid[{
     {Grid[{{
         Labeled[GeoGraphics[
           {GeoStyling[Directive[Opacity[0.5], Red], EdgeForm[Gray]],
              GeoDisk[#2, 4 10^4 Log[1 + #1]]} & @@@ Reverse[dataKilled][[1 ;; u]],
           GeoRange -> {{24, 50}, {-125, -67}}, GeoProjection -> "Mercator", ImageSize -> 500],
          Grid[{{Total[Reverse[dataKilled][[1 ;; u, 1]]], "Killed"}}],
          Top]
         ,
         Labeled[GeoGraphics[
           {GeoStyling[Directive[Opacity[0.5], Blue], EdgeForm[Gray]],
               GeoDisk[#2, 4 10^4 Log[2 + #1]]} & @@@ Reverse[dataInjured][[1 ;; u]],
           GeoRange -> {{24, 50}, {-125, -67}}, GeoProjection -> "Mercator", ImageSize -> 500],
          Grid[{{Total[Reverse[dataInjured][[1 ;; u, 1]]],
             "Injured"}}], Top]
         }}]},
     {Style[ Reverse[dataset[[2 ;; All, 1]]][[u]], Italic, FontFamily -> "Helvetica Neue", FontSize -> 32]},

     {ListPlot[{Reverse[dataKilled][[1 ;; u, 1]], Reverse[dataInjured][[1 ;; u, 1]]}, PlotRange -> {{0, Length[dataInjured]}, {-1, 15}},
       AxesLabel -> {Style["Mass Shootings", Bold, FontFamily -> "Helvetica Neue", FontSize -> 16],
         Style["People", FontFamily -> "Helvetica Neue", Bold, FontSize -> 16]}, PlotLegends -> {"Killed", "Injured"},
       PlotStyle -> {Directive[{Red}, Opacity[0.7], PointSize[Large]], Directive[{Blue}, Opacity[0.6], PointSize[Large]]},
       ImageSize -> 600, Ticks -> {Automatic, Range[15]}, TicksStyle -> Directive["Label", 12]]}},
    Spacings -> {1, 1}],
   FontFamily -> "Helvetica Neue", FontSize -> 24]
  , Style["Mass Shootings - 2016", FontFamily -> "Helvetica Neue", FontSize -> 40, Bold]
  , Top, Spacings -> {1, 2}], {u, 1, Length[dataInjured], 1}]
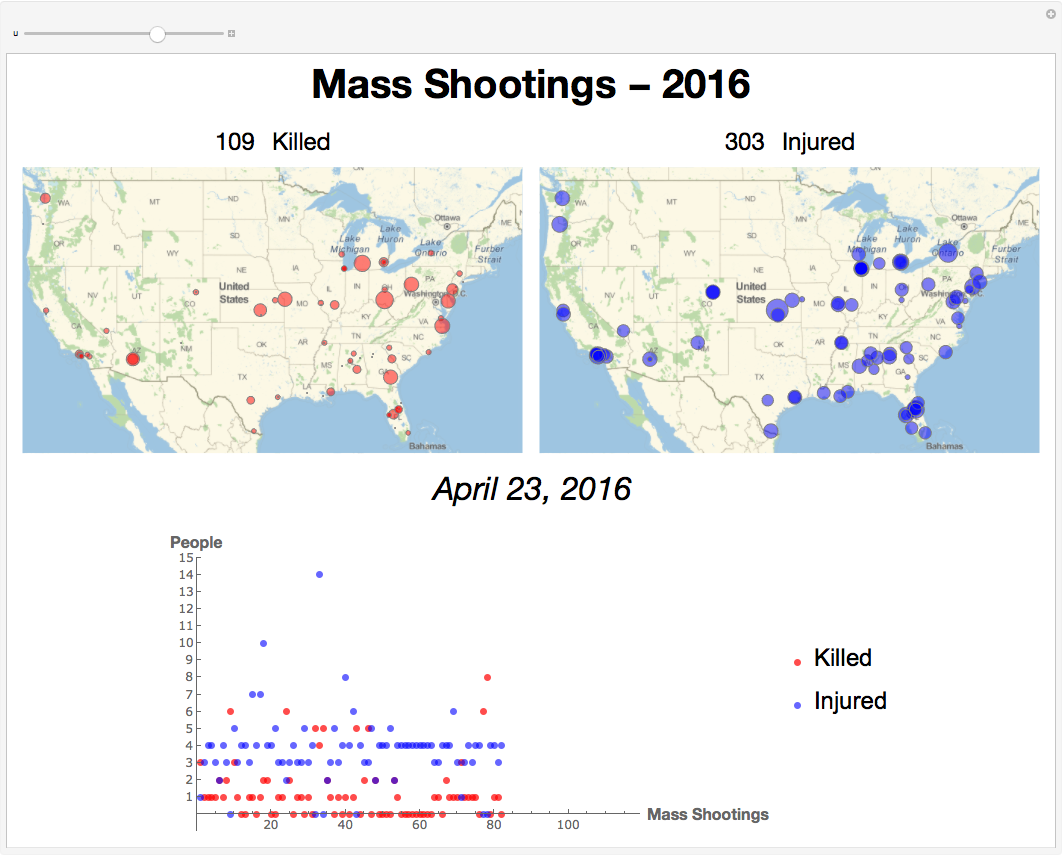
In conclusion, it seems that the American East has overall more mass shootings than its West counterpart. Probably, it would be interesting to do a comparison with the previous years. And a comparison between different countries could be also very interesting. Feel free to extend this analysis. Can't wait to see what you are coming up with!


