Hi there,
this is actually quite nice. Here is a function that generates the lists.
f[start_] := Module[{list = {start}}, NestWhileList[Total[IntegerDigits[#]^2] &, start, Unequal, All]]
We can now generate that for the first, say 100 integers:
Table[f[k][[-1]], {k, 1, 100}]
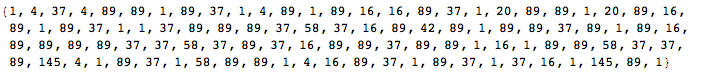
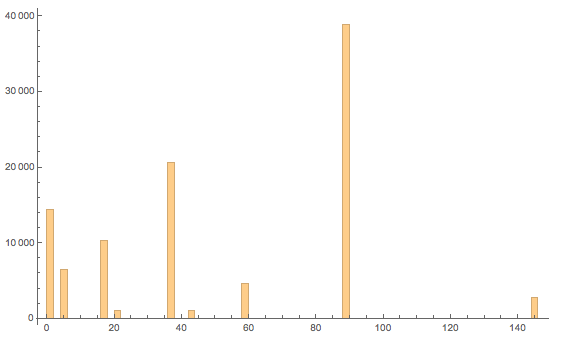
The ones indicate happy numbers - all the others are sad. The interesting bit is that the sequences only reach one out of nine numbers:
Histogram[Table[f[k][[-1]], {k, 1, 100000}], 200]
or
Tally[Table[f[k][[-1]], {k, 1, 100000}]] //TableForm
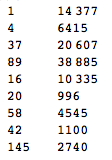
This table show the approximate relative frequencies of the terminal numbers.
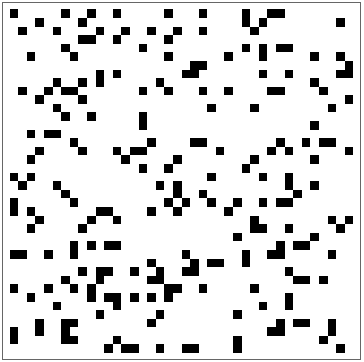
This here reveals little of a pattern:
Partition[Table[f[k][[-1]], {k, 1, 1600}] /. {x_ /; x != 1 -> 0}, 40] // ArrayPlot
You can also play with this:
Manipulate[Partition[Table[f[k][[-1]], {k, 1, 1600}] /. {x_ /; x != 1 -> 0}, UpTo[j]] // ArrayPlot, {j, 5, 80, 1}]
Cheers,
Marco


