Message Boards Message Boards

Visualization of happy and sad numbers

Anonymous User
Anonymous User
Posted 9 years ago

I'm trying to visualise the "happy" / "sad" numbers. The process: You take the digits of your starting number, square them and add them up. Now you take this number and do the same thing until you get either 1, which means your starting number is a happy number, or a number in this cycle: 4 - 16 - 37 - 58 - 89 - 145 - 42 - 20 (- 4), and therefore meaning you've started with a sad number.

Do[y = x; 
 y = Total[Power[#, 2] & /@ ToExpression@Characters[ToString@y]]; 
 GraphPlot[{x -> y}], {x, 99}]

This is my current code (how I read it): "y" gets the values of "x", afterwards you sum up the squares of y's digits, and finally you make a connection between the starting number and the number after this one iteration. -- What am I doing wrong?

I moved on as this didn't work, so I've printed the connections and put them into one GraphPlot, which did work. The only problem (I've attached it): it isn't clear and vivid. My idea is to change the size (and maybe colour [right now at most 15 different colours]) of the vertices depending on the number of iteration until it hits 1 or a number in the cycle 4 - 16 - etc. -- Is this possible?

enter image description here

Attachments:
POSTED BY: Anonymous User
11 Replies

Hi there,

this is actually quite nice. Here is a function that generates the lists.

f[start_] := Module[{list = {start}}, NestWhileList[Total[IntegerDigits[#]^2] &, start, Unequal, All]]

We can now generate that for the first, say 100 integers:

Table[f[k][[-1]], {k, 1, 100}]

enter image description here

The ones indicate happy numbers - all the others are sad. The interesting bit is that the sequences only reach one out of nine numbers:

Histogram[Table[f[k][[-1]], {k, 1, 100000}], 200]
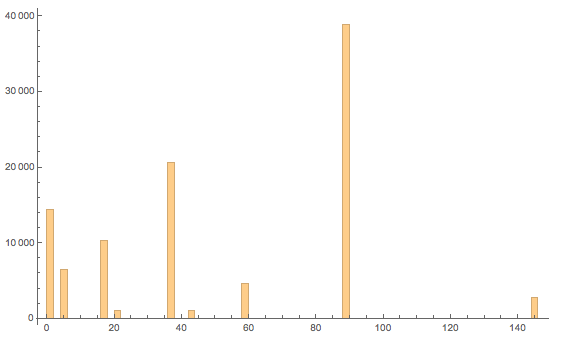
enter image description here

or

Tally[Table[f[k][[-1]], {k, 1, 100000}]] //TableForm
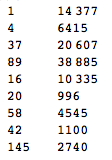
enter image description here

This table show the approximate relative frequencies of the terminal numbers.

This here reveals little of a pattern:

Partition[Table[f[k][[-1]], {k, 1, 1600}] /. {x_ /; x != 1 -> 0}, 40] // ArrayPlot
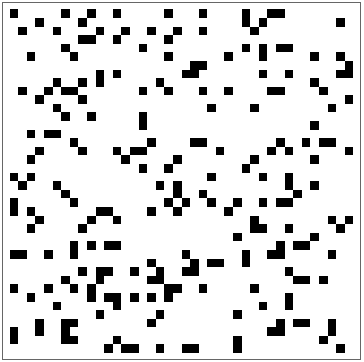
enter image description here

You can also play with this:

Manipulate[Partition[Table[f[k][[-1]], {k, 1, 1600}] /. {x_ /; x != 1 -> 0}, UpTo[j]] // ArrayPlot, {j, 5, 80, 1}]
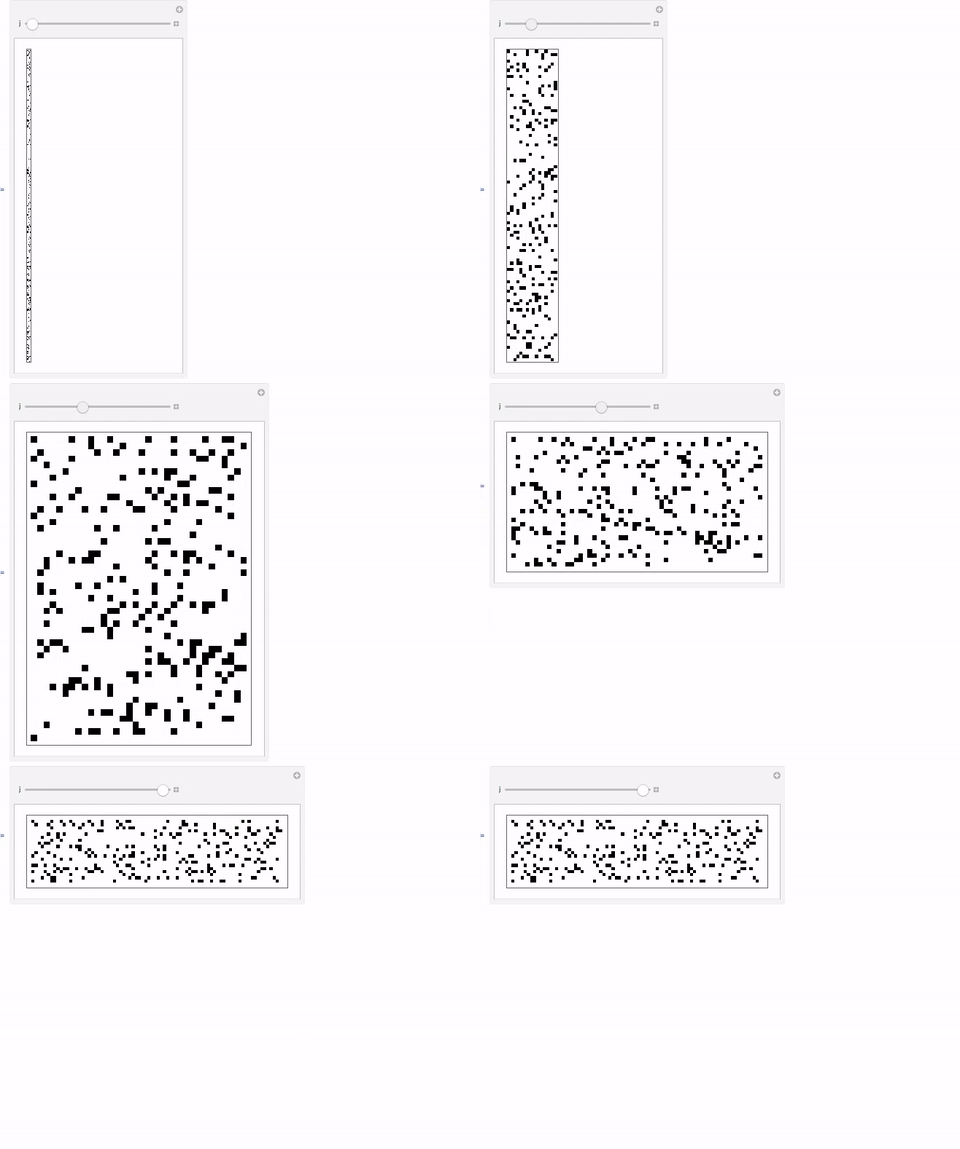
enter image description here

Cheers,

Marco

POSTED BY: Marco Thiel

Perhaps use the following code:

GraphPlot[
 Rule @@@ DeleteDuplicates[
   Partition[NestList[Total[IntegerDigits[#]^2] &, 4, 99], 2, 1]
   ]
]

Depending on the version you have you can use Subsequences[...,{2}] rather than Partition[...,2,1], Also you could probably use FindTransientRepeat in a nice way.

I'm not sure if I understand your question. But using ToString, Characters and ToExpression is definitely not fast, using IntegerDigits should be much much faster!

POSTED BY: Sander Huisman

Hi,

It is by the way indeed interesting to use graphs to visualise this:

Graph[# -> Total[IntegerDigits[#]^2] & /@ Range[10000]]

enter image description here

It turns out that there is a skeleton that is relatively stable.

GraphPlot[# -> Total[IntegerDigits[#]^2] & /@ Range[1000], Method -> "CircularEmbedding"]

enter image description here

and this

GraphPlot[# -> Total[IntegerDigits[#]^2] & /@ Range[200], Method -> "LinearEmbedding"]

look pretty, too, and have a meaning. I think, however, that the Layered Graph is the best visualisation:

LayeredGraphPlot[# -> Total[IntegerDigits[#]^2] & /@ Range[200]]

enter image description here

The upper graph contains the sad numbers and the lower one the happy ones. This also explains why you always reach one out of nine numbers. The lower graph has a fixed point. You always get to "1" and then stay there - that's happy. If you carefully look at the other graph you see that there is a cycle of eight vertices.

If you want to see that cycle you can use:

g = Graph[# -> Total[IntegerDigits[#]^2] & /@ Range[1000]];
cycle=FindCycle[g]
(*{{4 -> 16, 16 -> 37, 37-> 58, 58-> 89, 89-> 145, 145 -> 42, 42-> 20, 20-> 4}}*)

This can be used to highlight the subgraph:

HighlightGraph[g, cycle]

enter image description here

If you compare that to the table of my first reply all numbers are accounted for.

Cheers,

Marco

POSTED BY: Marco Thiel

I think Marco nailed it in terms of code compactness. I suggest, which seems stable layout-wise, invariant of Range[x] - and what does that mean actually?

Graph[# <-> Total[IntegerDigits[#]^2] & /@ Range[1000],
 GraphLayout -> "RadialEmbedding", GraphStyle -> "LargeNetwork", 
 VertexLabels -> Placed["Name", Tooltip]]

enter image description here

POSTED BY: Vitaliy Kaurov

Hi Vitaliy,

this is a beautiful representation. I do think that it would be important to use directed edges. Also, this looks really nice if you look at all paths to either the fixed point or up the the first repetition. If you plot that with overplayed (partially transparent) edges - similar to this beautiful post by @Bernat Espigulé Pons, you will see that a certain network gets more and more dominant. The outermost leaves/fringes get more and more "bushy". The tree grows, but there are some main arteries that lead to the fixed point or the cycle.

The frequencies in my first table obviously relate to the "trees" attached to the fixed point and the elements of the cycle respectively.

Cheers, Marco

PS: Still preparing the presentation for the Digital Humanities Conference at Oxford. Looking forward to meeting you there!

POSTED BY: Marco Thiel

Any forecast of this behavior - which is ratio of vertex number of happy and unhappy?

gfun[n_] := Graph[# <-> Total[IntegerDigits[#]^2] & /@ Range[n]]

data = ParallelTable[N[Divide @@ (Length /@ ConnectedComponents[gfun[k]])], {k, 500, 10000}];

ListLinePlot[data, PlotTheme -> "Detailed", AspectRatio -> 1/4, PlotRange -> All]

enter image description here

POSTED BY: Vitaliy Kaurov

Not sure if it goes to a constant... it seems to be increasing:

enter image description here

Value for 5*10^6: 6.1007

Value for 10^7: 6.04794

Value for 2*10^7: 6.17541

Value for 5*10^7: 6.15794

......

POSTED BY: Sander Huisman
Posted 9 years ago

Maybe not a constant but it does appear to be approaching a simple function as it approaches infinity, maybe linear or maybe a logarithmic.

A spectral image of the FFT of this series may be interesting.

POSTED BY: M Oehlen
Anonymous User
Anonymous User
Posted 9 years ago

Hi Sander

First of all, thank you for reminding me to use IntegerDigits instead of the other stuff.

I'm sorry that my questions are a bit confusing. The code you've presented wasn't exactly what I was looking for. I wanted to have a plot where all numbers are connected with each other. But I like your code because you can choose the starting number and watch what happens next. So thank you very much! :)

Cheers,

POSTED BY: Anonymous User

Also interesting the sequence in other bases:

ClearAll[gfun]
gfun[n_,b_:10]:=(#<->Total[IntegerDigits[#,b]^2])&/@Range[n]
Dynamic[b]
out=Table[{b,Length[ConnectedComponents[gfun[10^5,b]]]},{b,2,30}];
ListPlot[out]

The number of components as a function of the base:

enter image description here

POSTED BY: Sander Huisman
Anonymous User
Anonymous User
Posted 9 years ago

Hi Marco

Thank you very much for putting so much effort into this. You have shown me many ways to play around with these numbers and I find them very interesting. I'm looking forward to experimenting with all the input you gave me.

Have a good one!

POSTED BY: Anonymous User
Reply to this discussion
Community posts can be styled and formatted using the Markdown syntax.
Reply Preview
Attachments
Remove
or Discard

Group Abstract Group Abstract