Message Boards Message Boards

Mathematica 11 Release

Mathematica 11 is now out and ready to compute! Since the release of Version 10 two years ago, Mathematica has grown by leaps and bounds, with 500+ new functions. This version introduces both enhancements to computations across the board and completely new areas of functionality, continuing Mathematica's growth as the state-of-the-art technical platform—and we are very excited to share these developments with the world. Some of the most notable features include:

3D Printing

3D-Printed Triceratops

Computational Audio

Audio Image

Neural Networks

Neural Network

  • Define network topologies with NetGraph or with a chain of layers with NetChain.
  • Train your neural nets with NetTrain.
  • Train networks on either CPUs or NVIDIA GPUs.
  • Are your training sets of images too large to hold in-memory? The neural network functions support out-of-core image datasets.

Improved Machine Learning

Identifying Notable Celebrities

And these are only just a sample of the new features, including the Wolfram Channel Framework, enhanced notebook processing, cloud-aware WolframScript, improved symbolic and numeric calculus and so much more.

To read more about what's new in Mathematica 11, read Stephen Wolfram's release-day blog post and check out the New in 11 page.

POSTED BY: Zachary Littrell
41 Replies

You statement is much too subjective. What is a "small number"? What is a "small bug"?

Regardless, it seems to me that the majority of people who actually use Mathematica for critical work would clearly choose fewer functions and fewer bugs than what we have since about M10.0. I hear this again and again and I wholeheartedly agree with the opinion. Mathematica has expanded much too fast, and this had too great a cost in quality. There's a lot of functionality which seems not quite ready to use, and just doesn't get fixed.

What about units? They're extremely slow, simply unusable for real work.

What about all the curated data? The functions are so slow that usually it's better to just google up the data and import separately.

Import had issues which were partly fixed by SemanticImport but SemanticImport is again unusably slow for large data. What if you have to write your own parser for a file format? Interpreter seems excellent, but again it's unusably slow. I admit that the type of work I do with Mathematica may bias me, but I find it difficult to see how features like Interpreter and all the cloud stuff that it's meant to be used for are worth the effort. I don't know anyone who uses Mathematica and needs this for their work. But I constantly see the need to implement our own importers.

There are still many bugs where Mathematica returns wrong results with no warning and they just aren't fixed in new versions. There are plenty of examples in the graph theory functionality.

R/Link is an excellent tool, and clearly a lot of work went into it. But it has problems that make it difficult and painful to use in practice. Just think about using your own R installation, which is absolutely critical, yet still unsupported. After the first release, all work seems to have stopped. Compared to what R/Link already does, just a little more work would be needed to make it practically useful, but once a feature is released, it seems the priority is not to make it practically usable, but to add even more features.

I don't want stuff that's just good enough for a tweet-a-program demonstration. I want stuff that is of high enough quality and performant enough that it helps me in my daily work.

I was missing this plot, that always shows up at every release...

    funcs = WolframLanguageData[];
    versions = WolframLanguageData[funcs, "VersionIntroduced"];
    out = SortBy[Tally[versions], First];
    out[[All, 2]] = Accumulate[out[[All, 2]]];
    out = {#1, {If[IntegerQ[#1], 100, 50], #2}} & @@@ out;
    blue = RGBColor[0.37, 0.51, 0.71];
    cols = If[IntegerQ[#], blue, Lighter[blue]] & /@ out[[All, 1]];
    RectangleChart[Labeled[#2, Rotate[#1, \[Pi]/4], Below] & @@@ out, 
     BarSpacing -> 0, ImageSize -> 600, ChartStyle -> cols, Frame -> True,
      GridLines -> Automatic, 
     FrameTicks -> {{Automatic, Automatic}, {None, None}}]

enter image description here

POSTED BY: Sander Huisman

Examples in which the MMA 11.0 gives incorrect or strange solutions.

Example1:

Sum[Floor[5/5^k], {k, 1, \[Infinity]}](* It should be 1 *)

Example2:

eq = y[n] - 1 - 1*Sqrt[y[n]] - y[n + 1];
sol = First@RSolve[{eq == 0, y[0] == 1}, y[n], n];
Table[(y[n] /. sol), {n, 10}] // N
RecurrenceTable[{eq == 0, y[0] == 1}, y, 
    {n, 10}] // N(*Answers not the same *)

Example3:

eqn5 = (y'[x])^2 + y'[x]*y[x] - x == 0;
DSolve[{eqn5}, y[x], x](* strange results *)

Example4:

 FourierTransform[Exp[a*t ]/t, t, \[Omega]](*incorrect answer *)

Example5:

InverseLaplaceTransform[Coth[s], s, t]
InverseLaplaceTransform[Tanh[s], s, t]
InverseLaplaceTransform[Sech[s], s, t]
InverseLaplaceTransform[Csch[s], s, t]
(* strange results *)

Example6:

 Integrate[Sqrt[Exp[I*t]^2 - 1], {t, 0, Pi}](*incorrect answer *)

Example7:

 << Quaternions`
 Exp[Quaternion[1, 0, 0, 0]]
 (*bug or errors*)

Example8:

 Integrate[Sin[q]^2/Sinh[q]^2, {q, 0, \[Infinity]}](*incorrect answer *)
POSTED BY: Mariusz Iwaniuk

Put me in the "fewer functions and no bugs" category as well. Being a programming language, I can always add functionality that I need. Granted, I may introduce some bugs, but I have control over them.

I have suggested to people at Wolfram that it would be a great idea to have a major -- or even a .1 release -- that was nothing but a bug-fix release.

Advice to pre-release testers. In order to use the activation code for version 11 from the user portal, you'll need to delete the pre-release versions from your license file. If you don't, the activation code will not be asked for and your license will remain as the pre-release license.

POSTED BY: Frank Kampas

Just to avoid any misunderstandings: I think it is a very good thing that Mathematica is expanding in this direction. It seems to me that most use of M hasn't been primarily symbolic for many years. Machine learning, neural networks, better numerics, statistics, etc. all these are very welcome.

What I and many others don't think is a good thing is adding too many functions too quickly. There should be more focus on quality. Although a bit early to judge, it seems that the 11.0 release was better in this regard that the v10 release.

Features like curated data and cloud forms I don't see any use for. There may be a world parallel to what I know where people welcome these features but I don't know anyone who uses them. Actually I would welcome curated data if only it weren't unusably slow. Several minutes to download a 1-2 megabytes is not really acceptable.

P.S. In the lab where I work now no one else uses Mathematica. Everyone uses R, and several use Python. Some people know a bit of MATLAB, but don't really use it.

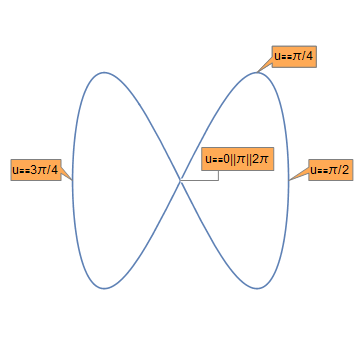
Sure, you can use Callouts on ParametricPlots! Here's an example:

enter image description here

All you need is Callout in the form of a Graphics primitive. Then you can use it on anything in Graphics: Circles, Rectangles, Lines, Points and anything else. It would have been nice if WRI had provided a Callout primitive instead of tying it up in a larger object. The Callout itself is just a little graphic. Generating a set of Callouts suitable to a curve or other object is another matter requiring some kind of heuristic algorithm. They don't have to be twisted together.

Help says that Callouts can also be used on Strings and equations. I can see it being useful on equations. But these don't seem to be implemented yet and there are no examples of them. But Callouts can be used in Graphics and it's possible to make a hack to produce a Graphics primitive. It may not be robust between versions because WRI is always messing with the underlying structure . (Why don't they make the underlying structure an Association so users could extract primitives for various objects?) Anyway, here's the routine:

CalloutPrimitive::usage = 
  "CalloutPrimitive[label,anchor,position] will produce a Callout \
primitive for use in Graphics. It takes the same options as Callout.";
SyntaxInformation[
   CalloutPrimitive] = {"ArgumentsPattern" -> {_, _, _, 
     OptionsPattern[_]}};
Options[CalloutPrimitive] = Options[Callout];
CalloutPrimitive[label_, anchor_, position_, 
  opts : OptionsPattern[]] := 
 ListPlot[Callout[{position, {10, 10}}, label, position, anchor, 
    opts]][[1, 4, 2, 1, 1]]

And here's the specification for the plot:

Show[
 {ParametricPlot[{Sin[u], Sin[2 u]}, {u, 0, 2 \[Pi]}],
  Graphics[
   {CalloutPrimitive[
     "u\[Equal]0||\[Pi]||2\[Pi]", {Sin[0], Sin[0]}, {0.35, -0.0},
     Background -> Lighter@Orange, Frame -> True, 
     FrameMargins -> {12, 7},
     Appearance -> "Leader"],
    CalloutPrimitive[
     "u\[Equal]\[Pi]/2", {Sin[\[Pi]/2], 
      Sin[2 \[Pi]/2]}, {1.4, 1} {Sin[\[Pi]/2], Sin[2 \[Pi]/2]},
     Background -> Lighter@Orange, Frame -> True, FrameMargins -> 7,
     Appearance -> "Balloon"],
    CalloutPrimitive[
     "u\[Equal]\[Pi]/4", {Sin[\[Pi]/4], 
      Sin[2 \[Pi]/4]}, {1.5, 1.05} {Sin[\[Pi]/4], Sin[2 \[Pi]/4]},
     Background -> Lighter@Orange, Frame -> True, FrameMargins -> 7,
     Appearance -> "Balloon"],
    CalloutPrimitive[
     "u\[Equal]\[Pi]/4", {Sin[\[Pi]/4], 
      Sin[2 \[Pi]/4]}, {1.5, 1.05} {Sin[\[Pi]/4], Sin[2 \[Pi]/4]},
     Background -> Lighter@Orange, Frame -> True, FrameMargins -> 7,
     Appearance -> "Balloon"],
    CalloutPrimitive[
     "u\[Equal]3\[Pi]/4", {Sin[3 \[Pi]/2], 
      Sin[2 3 \[Pi]/2]}, {1.5, 1.05} {Sin[3 \[Pi]/2], 
       Sin[2 3 \[Pi]/2]},
     Background -> Lighter@Orange, Frame -> True, FrameMargins -> 7,
     Appearance -> "Balloon"]}
   ]},
 PlotRange -> {{-1.5, 1.5}, {-1.5, 1.5}},
 BaseStyle -> {FontSize -> 12},
 Frame -> False, Axes -> False]

Example 1:

But

In[1]:= Sum[Floor[5/5^k], {k, 0, \[Infinity]}]

Out[1]= 6

In[2]:= Sum[Floor[5/5^k + 10^-1000000], {k, 1, \[Infinity]}]

Out[2]= 1

The bug is because of Sum[] function:

In[3]:= Table[Floor[5/5^k], {k, 1, 10}]

Out[3]= {1, 0, 0, 0, 0, 0, 0, 0, 0, 0}

Nice finds you two, now that's something to report ( http://www.wolfram.com/support/contact/email/?topic=Feedback )

Or -- You just use the menu item and enter the new activation code. You can delete the old one if you like, but it is not necessary.

You can check to see if the activation is yours or the pre-release by looking at About Wolfram Mathematica. If the Registered name is your name, then you have successfully entered your activation code. If it is (still) Arnoud Buzing (sp??), you need to enter your activation key using the Help/Enter Activation KeyÂ… menu item. You get the key itself from your user portal.

If you ever look at the file that contains the activation keys (use a text editor), it can have lots of keys. Mathematica uses the first on in the list that 'works'.

A software company I worked for years ago had a triage policy about bugs. Some were so critical they were fixed immediately. Less critical ones were fixed in the next release. Some were regarded as being sufficiently insignificant that they were never fixed. I don't know Wolfram Research's policy but I suspect it is similar.

POSTED BY: Frank Kampas

I have gotten several emails this weeks from bugs that I supplied to them in 2014/2015, so it can take 2 years...

I think another major issue is that when you have many many bugs that you have to prioritize them into:

  • priority (can be very tricky)
  • difficulty of solving (can be even more tricky!)

For 10 bugs this is doable, but if you have 100s or 1000s this is nearly impossible!

POSTED BY: Sander Huisman

Szabolcs, I would be interested in knowing what, for you personally, the primary usage of Mathematica is? And what, in your wide connections in the Mathematica world, do you see as the actual major usage for other users?

For myself, I see Mathematica not so much as a super graphical calculator or as a programming language (although it is in part these things) but as a medium on which I can learn, develop and communicate ideas in mathematics, physics, chemistry, engineering and science in general, for myself and with other people. I look on a Mathematica notebook as a blank piece of paper on which I'm writing text, equations, axioms, derivations, algorithms and specifications for various graphics and dynamic presentations. These kind of documents are orders of magnitude better than the major publication media used today.

I don't understand why Mathematica has many of the features it does if this was not a major intended usage. Why styled notebooks with Titles and Sectional groupings? Why all the dynamics if you're the only one who is going to look at it? A very nice feature in Version 11 is the immediate spell checking. But why have this if you're not writing for others? I would be convinced that WRI had succeeded if I saw Mathematica notebooks or notebooks backed by applications on http://arxiv.org/.

I could go on and on, but basically I think WRI should better perfect this usage, give more support to people trying to use it, and give more realistic promotion to it.

I will jump in here: I think that you are exactly right. Mathematica is a 'new thing' that does not fit well in standard categories.

I have always used Mathematica as an exploratory tool, and with more capabilities and better hardware, I can do more. For my job, I needed to create a deployable product, which meant rewriting a lot of stuff in C. From time to time, I think it would be great if it were possible to deploy a 'shrink-wrapped' product using Mathematica exclusively, but I don't think that this is what Wolfram Research is really interested in.

Right now, I am using Mathematica to learn or relearn a lot of stuff that I missed in both maths and computer science. At some point, it may be in a format that would interest other people. When it is, I hope that there will be better places to share. The demonstration project is nice, but to narrow for anything other than toy examples. Posting code to the community is a possibility, but it seems to work best for very short programs. From time to time, Wolfram Research talks about a marketplace where things could be shared, and I hope that this comes to fruition. Having a means to publish .nb files to arXiv would be great.

Based on my own experience using Mathematica to learn things like calculus or differential equations, I can see that Mathematica is disruptive technology. This may help to explain why there has only been sporadic implementation in education -- MatLab or Java Applets are much easier to shoehorn into our now centuries-old curriculum. I have some ideas about this, but I have zero experience in teaching maths. For me, the primary use of Mathematica is creating playgrounds for learning, and I mean by 'learning' not what passes for education in schools, but acquiring real understanding.

In my opinion, all the curated data is useful, but secondary. Just as I was able to stop using log and trig tables when I got my first HP-35, the curated data in Wolfram Language makes it possible to get information in this way rather than having a bunch of reference books or websites. I keep thinking, though, that this is a separate product that just happens to ship with Mathematica.

For me, Mathematica is the most transparent means of expression I have ever used. It does take effort -- quite a lot, actually -- to achieve this level of fluency, but the effort is well rewarded.

In reply as to whether the Show paradigm is a serious inconvenience:

I have always thought that graphics would be much easier and more intuitive if it was based on the idea that everything in graphics is a graphics primitive (as well as an expression.) So, for example, if you draw a curve or a surface it will be returned as an object that works as a primitive at the Graphics level instead of the Show level. Graphics primitives can be easily manipulated individually and combined. It's easier to understand options if one understands that some of them apply to what is being drawn and others to the overall plot appearance. It is difficult for many users to understand how options are picked up in the Show statement. Also with Show one has to jump back and forth to the Graphics level, or use Epilog. Then what happens if you use Epilog in two Plot statements? Consider the following rather artificial example.

Show[
 Plot[Sin[x], {x, 0, 2 \[Pi]},
  Epilog -> Text["Sin", {3 \[Pi]/4, Sin[3 \[Pi]/4]}, {-1, -1}]],
 ParametricPlot[{x, Cos[x]}, {x, 0, 2 \[Pi]}, PlotStyle -> Orange,
  Epilog -> Text["Cos", {7 \[Pi]/4, Cos[7 \[Pi]/4]}, {1, 1}]]]

The second Epilog option is lost. Sure, we were warned that the non-default (which are those?) options are concatenated. But does the average user notice that, or is he aware of the implications? He could include the second Text statement in the first Epilog, but is that intuitive since it goes with the other curve? He could use level jumping between Show and Graphics. Or he could put them both at the end. But if the plot has many primitives in it then the Epilog statement becomes the tail that wags the dog, and things that go together are separated. If he wants to keep things together that go together then he has to use lots of Graphics wrappers. Wouldn't something like this be much simpler and more intuitive?

Graphics[
 {Draw[Sin[x], {x, 0, 2 \[Pi]}],
  Text["Sin", {3 \[Pi]/4, Sin[3 \[Pi]/4]}, {-1, -1}],
   ParametricDraw[{x, Cos[x]}, {x, 0, 2 \[Pi]}, PlotStyle -> Orange],
   Text["Cos", {7 \[Pi]/4, Cos[7 \[Pi]/4]}, {1, -1}]},
 Frame -> True]

In the Help for Show it says "Options explicitly specified in Show override those included in the graphics expression." Then what about the following?

Show[
 Plot3D[Sin[x y], {x, 0, \[Pi]}, {y, 0, \[Pi]},
  PlotStyle -> ColorData["Crayola"]["Chestnut"]],
 ParametricPlot3D[{x, y, Sin[x] Cos[y]}, {x, 0, \[Pi]}, {y, 0, \[Pi]},
  PlotStyle -> ColorData["Crayola"]["GrannySmithApple"]],
 Lighting -> "Neutral"
 ]

Hmm, will the second PlotStyle option be picked up, since the second Epilog option wasn't? Yes it will because it's not a default option. Everybody knows that. Right. The Lighting option is definitely not picked up by the surfaces generated by the two plot statements. And that is because Mathematica automatically builds Lighting->Automatic into the primitives of the surfaces. If you want a single specified Lighting for the entire plot (the most common case) you have to specify it in each of the individual plot statements. Who would have thought? I think any serious person would call that inconvenient.

There could still be the customary set-piece plots for common types of graphics but they wouldn't have to cover everything because users could always repair to the primitive level if they wanted highly customized graphics.

There may be a reason why Callout works with Plot but not with ParametricPlot. With Plot you typically have lines that run more or less parallel from left to right, with only a few crossings, if at all. In such a situation the placement of the callouts to avoid overlappings is somehow manageable. With ParametricPlot the crossings are so unpredictable that a general satisfying algorithmic placement is much more difficult. Maybe they will work on it for future versions. Just my guess. Still a novice at Callout.

POSTED BY: Gianluca Gorni

Are you a 'prerelease'-tester (beta-tester)? If not, perhaps you can sign up; send them an email prerelease@wolfram.com I'd bet they would have liked to know about this before release. They intend to resume the prerelease program for version 11.1

POSTED BY: Sander Huisman

No I'm not a Beta tester. A lot of Bugs can be found on this Website,only need to test(for Bugs) them for MMA 11.0.

POSTED BY: Mariusz Iwaniuk

From my experience: they respond much faster to problems found in beta-versions...

POSTED BY: Sander Huisman

Thanks. Maybe I'm send them a e-mail. :)

POSTED BY: Mariusz Iwaniuk

These are not regressions. They were known before, as I remember several of these examples from StackExchange. I think what Mariusz meant was that even though these were known problems, they were still not fixed in version 11.

To be fair, I should note that my subjective impression was that symbolic math related bugs like these got fixed with higher frequency than other problems. This is based on going through a few random bugs-tagged questions on StackExchange and seeing which got fixed.

The first sum starts at 0, the second one starts at 1

POSTED BY: Frank Kampas

Yes!

No need to delete your license file manually:

http://support.wolfram.com/kb/5572

POSTED BY: Sander Huisman

Aah ok, because it was a reply to this thread I assumed they were 'fresh' bugs ;) nonetheless, submitting bugs to wolfram gives it a good(better?) chance of having them fixed...

POSTED BY: Sander Huisman
Posted 8 years ago

Hi,

Before even trying the recent version 11, I would need to know whether the following bugs have been fixed :

1) Graphs with multiple edges and problems with edges layouts and colouring

In fact, this is a direct question to Szabolcs Horvat, since he knows well the multiple edges issue and, I guess, can give a definitive answer.

http://community.wolfram.com/groups/-/m/t/603839?ppauth=5D8cHSgm

2) Problems with 'Hyperlink["label",("notebook.nb"',"celltag"}]

http://community.wolfram.com/groups/-/m/t/840952?ppauth=5D8cHSgm

Thank you

Martin.

POSTED BY: E Martin

I used notepad++ to delete the prerelease lines from the license file.

POSTED BY: Frank Kampas

It would have been nice if they had told the pre-release testers about the menu item.

POSTED BY: Frank Kampas
Posted 8 years ago

No!

None of them has been solved in Version 11.

Another two bugs left behind.

POSTED BY: E Martin
Posted 8 years ago

It sounds that it could be the case, although, sometimes, the judgment of the strategists about the supposed best corporation strategy or policy to implement does not fit exactly what the market is willing to accept. The key concept is the evaluation of that referred to as "less critical",

Mutatis mutandis, the policy what you call a 'triage' policy is well known and widely used in many fields, and it is called the «Tombstone Philosophy», «Tombstone Mentality», «Tombstone Strategy», «Tombstone Technology»..., depending on the field it is exploited.

There is a lot of literature on the subject and its drawbacks.

And again mutatis mutandis, its application has costed the survival to some well known and very powerful companies.

POSTED BY: E Martin

Given the choice between a small number of functions and no bugs or a larger number of functions with some small bugs, which would you chose?

POSTED BY: Frank Kampas

A friend of mine e-mailed me that a list of programming languages by popularity showed Mathematica far down the list and that google trends showed that Mathematica is losing ground compared to MATLAB. I suspect that the shift away from symbolic and numerical calculation to machine learning, curated data, etc. is in response to all this. In the list of programming languages by popularity, R was 3rd on the list, which took me by surprise, but probably shouldn't have.

POSTED BY: Frank Kampas
Posted 8 years ago

Put me in the "fewer functions and no bugs" category as well. Being a programming language, I can always add functionality that I need. Granted, I may introduce some bugs, but I have control over them.

Put me in that category too.


Finally, I found a workaround for the bug in

Hyperlink[graphicslabel,{notebbok, celltag}];

but it has taken me days to find it; and still, I am not sure whether it is going to work in every situation. For now it works for edges in a single edged Graph (no more than an edge between two vertices).

Apart from the bug itself, the reason why it has taken me that long is the, for me, misleading documentation or the lack of it after the bug has been discovered. Why Wolfram did not inform of it and recommended the eventual workaround if they are not to ready fixit it?

The following is from the Mathematica help system

If you want to do simple operations on Wolfram System notebooks, then you will usually find it convenient just to use the interactive capabilities of the standard Wolfram System front end. But if you want to do more complicated and systematic operations, then you will often find it better to use the kernel.

However, probably we don't even need the materials in Manipulating Notebooks from the Kernel; in the end, in Mathematica «everything is an expresion» and probably the necessary and sufficiente tools to circumvent the bug were already in version 1.

Besides, the triviality of the form that I have used to circumvent the bug tells me that something more important that the bug itself is behind the lack of a direct fix in the right place, out of the «Manipulating Notebooks from the Kernel» stuff.

In any case, definitively, the documentation needs a fix.

For the rest, I fully agree with Szabolcs' posts.

POSTED BY: E Martin
Posted 8 years ago

How does one measure popularity? "Like": buttons or revenue?

POSTED BY: Douglas Kubler
Posted 8 years ago

From the help about Callout[]

Callout[data,expr, ... ] can be used as a wrapper in visualization functions such as Plot, ListPlot, etc....

In my trial V11, Callout does not work in ParametricPlot

poly = {{0, 0}, {1, 1}, {2, 0}, {3, 2}};
f = BezierFunction[poly]

Check any of these, neither of them works

ParametricPlot[Callout[f[t], "label", f[.5]], {t, 0, 1}]
ParametricPlot[Callout[f[t], "label", After], {t, 0, 1}]

However, this does work

data = Table[f[t], {t, 0, 1, .001}];
ListPlot[Callout[data, "label"], Joined -> True]

This also works

ListPlot[{Callout[f[.5], "label", f[.5]*{1.1, 1.4}]}, 
 PlotStyle -> Red]
Show[ParametricPlot[f[t], {t, 0, 1}], 
 ListPlot[{Callout[f[.5], "label", f[.5]*{1.1, 1.4}]}, 
  PlotStyle -> Red]]

but at the cost of using Show to mix artificially two graphics: 1) the curve and 2) the callout.

The need of using show is a serious inconvenience, because the introduction of callouts in the context of parametric curves makes the situation unnatural, unnecessary and messy.

Anayway, if Callout is meant not to work with ParametricPlot, it should have been explicitly documented except if ParametricPlot is not included by definition in the set of "... functions such as Plot, ListPlot, etc..." or, in other words, if the expression, "... functions such as Plot, ListPlot, etc..." explicitly excludes ParametricPlot., or even ParametricPlot is not considered a visualization function.

POSTED BY: E Martin

It might be more tricky when ParametricPlot returns a surface(region, area) when you have 2 parameters, and it is therefore omitted. Plot, ListPlot, ListLogPlot all have a list of Wrappers they support. Notice that ParametricPlot does not have such a list:

enter image description here

I agree that it should be added, but as of now I don't think they claim they do...

Unfortunately there is not (yet) a callout graphics primitive that you could easily add as an Epilog/Prolog... But Show works fine and is not a 'serious inconvenience'.

POSTED BY: Sander Huisman

That is nice! It even kind-of works with GeoGraphics:

GeoGraphics[{Point[GeoPosition[{1, 1}]], 
  CalloutPrimitive["here", {1.1, 1.1}, {1, 1}]}, 
 GeoRange -> {{0, 2}, {0, 2}}]

although it has trouble with options:

GeoGraphics[{Point[GeoPosition[{1, 1}]], 
  CalloutPrimitive["here", {1.1, 1.1}, {1, 1}, 
   Background -> Lighter@Orange, Appearance -> "Balloon"]}, 
 GeoRange -> {{0, 2}, {0, 2}}]

Unfortunately GeoListPlot does not seem to accept Callout.

POSTED BY: Gianluca Gorni
Posted 8 years ago

A friend of mine e-mailed me that a list of programming languages by popularity showed Mathematica far down the list and that google trends showed that Mathematica is losing ground compared to MATLAB.

Last night I was looking at ranking lists of programming languages. I have been trying to decide if I should focus only on Mathematica or learn Python SymPy using a Continuum Anaconda Python (re)installation. I was surprised to discover Mathematica does not even make the top 48. Here is the 2016 IEEE Spectrum ranking list. Here is the StatisticsTimes page with 4 different ranking lists. Each of these different ranking lists measure popularity using different metrics.

PYPL has 3 tables on StatisticsTimes, Worldwide, USA and India. MATLAB is more popular in India than in the USA. MATLAB jumped 7 notches in India from Sep 2015 to Sep 2016. MATLAB is expensive to use, even for Home Users. With all of the toolboxes required for math, statistics, etc..., the cost would be $680.

Python is always in the top 5. The advantage of Python is all of the packages are always being updated. It is also free of course. The disadvantage is it is text-based. The mathematics don't look very "math-like." They look awful. Maxima is also free.

POSTED BY: Dan M

From what I gather, most lists if the most popular languages are based on things like github traffic, etc.

I'd guess that more than 90% of Mathematica users do not use the language in this way -- their usage simply stays below the RADAR of all these lists. While it would be nice if it were easy to make 'shrink wrapped' apps with Wolfram Language, this is not the main use for the language.

One could probably say that Mathematica is a language for people who what to get things done, but who don't want to be programmers. I would have no idea how to quantify that type of user.

There are almost certainly enough users for Wolfram Research to be a (quite) profitable company.

Although inherently subjective, I would like to see a list of the most useful languages for different types of computing tasks. I think that a lot more people use -- or could use -- Mathematica for the types of tasks it was designed for than a lot of other 'popular' languages.

Posted 8 years ago

Regardless, it seems to me that the majority of people who actually use Mathematica for critical work would clearly choose fewer functions and fewer bugs than what we have since about M10.0. I hear this again and again and I wholeheartedly agree with the opinion. Mathematica has expanded much too fast, and this had too great a cost in quality. There's a lot of functionality which seems not quite ready to use, and just doesn't get fixed.

IMHO, the reason why Wolfram Inc. continues to release more functions is probably because they have so much competition. Not only do they have MATLAB Home R2016b and Maple 2016 Personal Edition, but they also have free open source such as Python SymPy and Maxima competing with them. Depending on which ranking list you look at, Python is ranked either 2, 3 or 5 in the world.

Perhaps Wolfram Inc. wants to increase their ranking in the world. Another reason could be Wolfram Inc. wants to give their current users a reason to upgrade.

POSTED BY: Dan M
Posted 8 years ago

One could probably say that Mathematica is a language for people who what to get things done, but who don't want to be programmers. I would have no idea how to quantify that type of user.

That is exactly why I am using Mathematica 10.0.2. I don't want to take a lot of time programming, dealing with coding, pointers, sorting, etc, etc... I want to get things done, fast.

I am considering upgrading to Mathematica 11.0.0. However, after dealing with Mathematica 10.0.1, I don't know if I should. Please see my "Stability of Mathematica 11.0.0?" question I posted today.

POSTED BY: Dan M
Reply to this discussion
Community posts can be styled and formatted using the Markdown syntax.
Reply Preview
Attachments
Remove
or Discard

Group Abstract Group Abstract