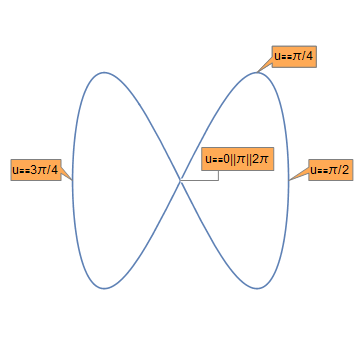
Sure, you can use Callouts on ParametricPlots! Here's an example:

All you need is Callout in the form of a Graphics primitive. Then you can use it on anything in Graphics: Circles, Rectangles, Lines, Points and anything else. It would have been nice if WRI had provided a Callout primitive instead of tying it up in a larger object. The Callout itself is just a little graphic. Generating a set of Callouts suitable to a curve or other object is another matter requiring some kind of heuristic algorithm. They don't have to be twisted together.
Help says that Callouts can also be used on Strings and equations. I can see it being useful on equations. But these don't seem to be implemented yet and there are no examples of them. But Callouts can be used in Graphics and it's possible to make a hack to produce a Graphics primitive. It may not be robust between versions because WRI is always messing with the underlying structure . (Why don't they make the underlying structure an Association so users could extract primitives for various objects?) Anyway, here's the routine:
CalloutPrimitive::usage =
  "CalloutPrimitive[label,anchor,position] will produce a Callout \
primitive for use in Graphics. It takes the same options as Callout.";
SyntaxInformation[
   CalloutPrimitive] = {"ArgumentsPattern" -> {_, _, _,
     OptionsPattern[_]}};
Options[CalloutPrimitive] = Options[Callout];
CalloutPrimitive[label_, anchor_, position_,
  opts : OptionsPattern[]] :=
 ListPlot[Callout[{position, {10, 10}}, label, position, anchor,
    opts]][[1, 4, 2, 1, 1]]
And here's the specification for the plot:
Show[
 {ParametricPlot[{Sin[u], Sin[2 u]}, {u, 0, 2 \[Pi]}],
  Graphics[
   {CalloutPrimitive[
     "u\[Equal]0||\[Pi]||2\[Pi]", {Sin[0], Sin[0]}, {0.35, -0.0},
     Background -> Lighter@Orange, Frame -> True,
     FrameMargins -> {12, 7},
     Appearance -> "Leader"],
    CalloutPrimitive[
     "u\[Equal]\[Pi]/2", {Sin[\[Pi]/2],
      Sin[2 \[Pi]/2]}, {1.4, 1} {Sin[\[Pi]/2], Sin[2 \[Pi]/2]},
     Background -> Lighter@Orange, Frame -> True, FrameMargins -> 7,
     Appearance -> "Balloon"],
    CalloutPrimitive[
     "u\[Equal]\[Pi]/4", {Sin[\[Pi]/4],
      Sin[2 \[Pi]/4]}, {1.5, 1.05} {Sin[\[Pi]/4], Sin[2 \[Pi]/4]},
     Background -> Lighter@Orange, Frame -> True, FrameMargins -> 7,
     Appearance -> "Balloon"],
    CalloutPrimitive[
     "u\[Equal]\[Pi]/4", {Sin[\[Pi]/4],
      Sin[2 \[Pi]/4]}, {1.5, 1.05} {Sin[\[Pi]/4], Sin[2 \[Pi]/4]},
     Background -> Lighter@Orange, Frame -> True, FrameMargins -> 7,
     Appearance -> "Balloon"],
    CalloutPrimitive[
     "u\[Equal]3\[Pi]/4", {Sin[3 \[Pi]/2],
      Sin[2 3 \[Pi]/2]}, {1.5, 1.05} {Sin[3 \[Pi]/2],
       Sin[2 3 \[Pi]/2]},
     Background -> Lighter@Orange, Frame -> True, FrameMargins -> 7,
     Appearance -> "Balloon"]}
   ]},
 PlotRange -> {{-1.5, 1.5}, {-1.5, 1.5}},
 BaseStyle -> {FontSize -> 12},
 Frame -> False, Axes -> False]