The new computational audio features of Mathematica are really impressive. In no time you can cook up things as soon as you understand the basic algorithm. Even the simplest tricks can give quite surprising results. Before you read on, please do play this (file also uploaded to this post):
audio file.
Have you noticed anything? I think that it sounds pretty much like the well known example
ExampleData[{"Sound", "Apollo11SmallStep"}]
As a matter of fact, it contains something a little special. If you import the file into Mathematica
secsound = Import["/Users/thiel/Desktop/secretsound.wav"];
and calculate a spectrogram of it
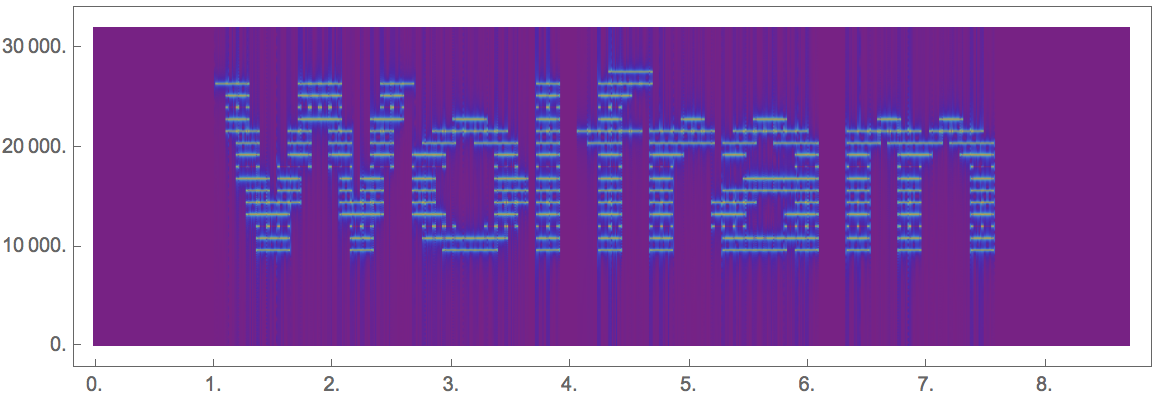
Spectrogram[secsound, ColorFunction -> "Rainbow", Frame -> None, ImageSize -> Full]
you get this:

How to inject images into spectrograms
I will show now, how you can get this in a couple of lines of code. First we need to get a binary matrix (later we can do better!) of the message. This is quite straight forward:
imgdata = Reverse@ImageData[ColorNegate@Image[Binarize[Rasterize[Text[" Wolfram "], RasterSize -> 100, ImageSize -> 100]]]];
There is nothing really tricky in here. The text is "Wolfram", I rasterise the image and resize it. Then I binarise it. The ColorNegate is needed to exchange ones and zeros in the matrix. Because I play with images and matrices, and they have a different coordinate system (the origin is at different corners) I need to Reverse the whole thing. I can plot the result like so:
ArrayPlot[Reverse@imgdata]

I now need to generate a sound that produces high amplitudes at the right places in the Spectrogram. At each and every place in the imagedata matrix that contains a one I need to proceed a little sine wave with the right frequency. The rows correspond to frequencies and the rows to time. So lets collect the different frequencies at each time:
list = Flatten[Position[#, 1]] & /@ Transpose[imgdata];
Ok. Next we generate the corresponding sums of Sin-functions and generate a list of data from them.
listcompete = 0.1*Flatten[Table[Table[N@Total[Sin[2 Pi 300 # t] &@(# & /@ list)[[k]]], {t, 0, 8.71/200., 1/16000}], {k, 1, 100}], 1];
We can generate the corresponding sound:
Audio[Sound[SampledSoundList[listcompete, 8000]]]
This gives you a little window like this

which allows you to "listen to Wolfram in dolphin language". The file is attached to this post and sounds really cool.
How to hide the images in sound files/music
In order to hide the string in the "A small step ..." recording, we first shift the frequencies a little bit and decrease the amplitude:
listcompete2 = 0.02*Flatten[Table[Table[N@Total[Sin[2 Pi 1200 # t] &@(# & /@ list)[[k]]], {t, 0, 8.71/100., 1/64000}], {k, 1, 100}], 1];
It looks now like this:
Spectrogram[Sound[SampledSoundList[listcompete2, 64000]], ColorFunction -> "Rainbow"]

If you want to listen to it use:
Audio[Sound[SampledSoundList[listcompete2, 64000]]]
You should hear a sort of hissing sound. The new function AudioChannelCombine will now help us to merge the two sound objects:
AudioChannelCombine[{Audio[ExampleData[{"Sound", "Apollo11SmallStep"}]], Audio[Sound[SampledSoundList[listcompete2, 64000]]]}]
The resulting object is attached to this post. The spectrogram
Spectrogram[AudioChannelCombine[{Audio[ExampleData[{"Sound", "Apollo11SmallStep"}]],
Audio[Sound[SampledSoundList[listcompete2, 64000]]]}], ColorFunction -> "Rainbow", Frame -> None]

clearly shows the secret message blended into the Apollo message.
Like this you can export the sound object:
secsound = Import["/Users/thiel/Desktop/secretsound.wav"];
Look for hidden messages
This type of procedure is quite well known. I also saw it on BBC's Click, but I cannot remember the episode. Now you can use this to look for hidden messages in the internet or in music. Here are two examples: file1 and file2, both from the website above.
Let's look at file1
Spectrogram[snd, 150, Frame -> None]

and file2
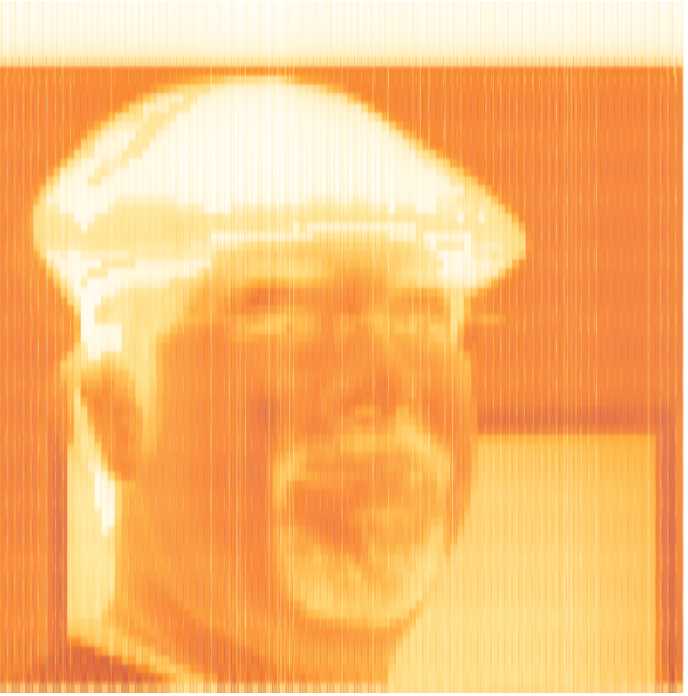
Spectrogram[Import["http://www.evansalazar.com/ohmpie/imageEncode/evan.mp3"], 150, Frame -> None, AspectRatio -> 1]

You can clearly see that the second image is actually "grayscale". It is quite possible to achieve this by not Binarize-ing the image and using the grayscale values as amplitudes.
Where to go from here?
We could certainly try to increase the resolution and get everything into a nice little function to do all the steps for us. Another interesting thing would be to add multiple images/slices of a 3 D image into sound, and basically hide an entire 3D object. I'd love to see this being 3D printed.
Can you detect the message in this sound file?
Cheers,
Marco
 Attachments: