Recently
Christopher coded a neat wavelet-based method for peak detection. Peak detection is often needed in various scientific fields: all sorts of spectral analysis, time series and general feature recognition in data come to mind right away. There are many methods for peak detection. Besides his wavelet-based code Christopher also mentions a built-in MaxDetect function rooted in image processing.
MaxDetect, though, being a rather elaborate tool for multi-dimensional data (2D, 3D images) and with a specific image-processing-minded parameter tuning, was not meant to target time series and other 1D data. This got me thinking.
Can we come up with a minimal compile-able peak detection code that would be accurate, robust and fast in most situations for 1D data?I am not an expert in the subject, but intuitively peak detection consists of two stages.
- Finding all maxima. This can be done via Differences with selection of neighbor difference pairs that change from positive to negative. Such pair would indicate local maximum.
- Filtering out peaks. Selecting those maxima that are high splashes of amplitude with respect to its immediate neighborhood. Quoted words are relative and depend on particular data. This is why they are set as tuning parameters in the algorithm.
To illustrate 2nd point lets take a look at the
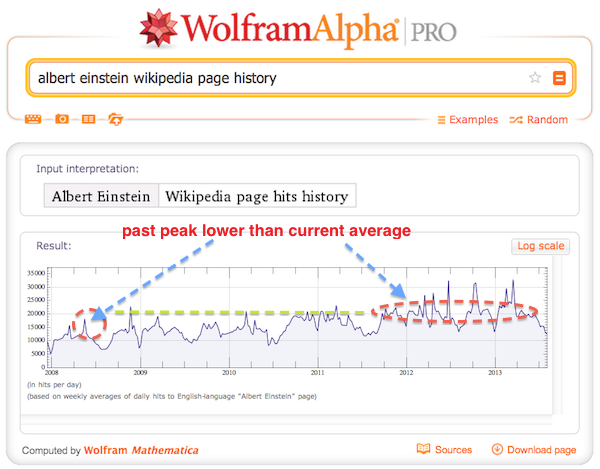
Albert Einstein Wikipedia page hits history below. Obviously a large peak in the past can be lower than current average in case if there is strong trend in the data. This is why we need windowing when looking for peaks, - to compare a peak to its immediate neighborhood.

Without further ado here is a function written specifically in terms of functions that can be compiled. For example I do not use MovingAverage, but do trick with Partition instead.
PeakDetect = Compile[{{data, _Real, 1}, {width, _Integer}, {cut, _Real}}, (Table[0, {width}]~Join~
Map[UnitStep[# - cut] &, data[[1 + width ;; -1 - width]] - Map[Mean, Partition[data, 1 + 2 width, 1]]]~Join~
Table[0, {width}]) ({0}~Join~ Map[Piecewise[{{1, Sign[#] == {1, -1}}, {0, Sign[#] != {1, -1}}}] &,
Partition[Differences[data], 2, 1]]~Join~{0}), CompilationTarget -> "C"];
The legend for the function arguments is the following:
- data 1D numerical list of data
- width half-width of the moving average window not including central point
- cut threshold at which to cut off the peak in natural units of data amplitudes
Now lets see some usage cases. Lets import the same Albert Einstein data as a proof of concept.
raw = WolframAlpha[ "albert einstein", {{"PopularityPod:WikipediaStatsData", 1}, "TimeSeriesData"}];
data = raw[[All, 2]][[All, 1]];
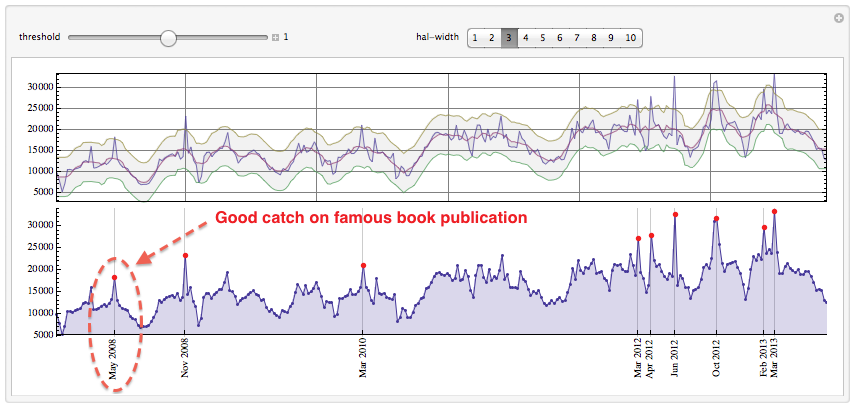
We use total window width of 5 points here and cut off peak at a standard deviation of the whole data. The peak labeled May 2008 is nicely picked up even though it is comparable then current average. This peak is most probably due to publication on May 13, 2008 of
one of the most famous books about Einstein marked as New York Times bestseller that also got award Quill Award. Of course you can play with controls to pick or drop peaks. On the top plot one sees data, moving average, and bands formed by moving average displaced up and down by fraction of standard deviation. Any maximum above the top band becomes a peak.

The code for the app is at the very end. Lets try a different data set recent sun spot activity.
raw = WolframAlpha["sun spot", {{"SunspotsPartialTimeSeries:SpaceWeatherData", 1}, "TimeSeriesData"}];
data = raw[[All, 2]];
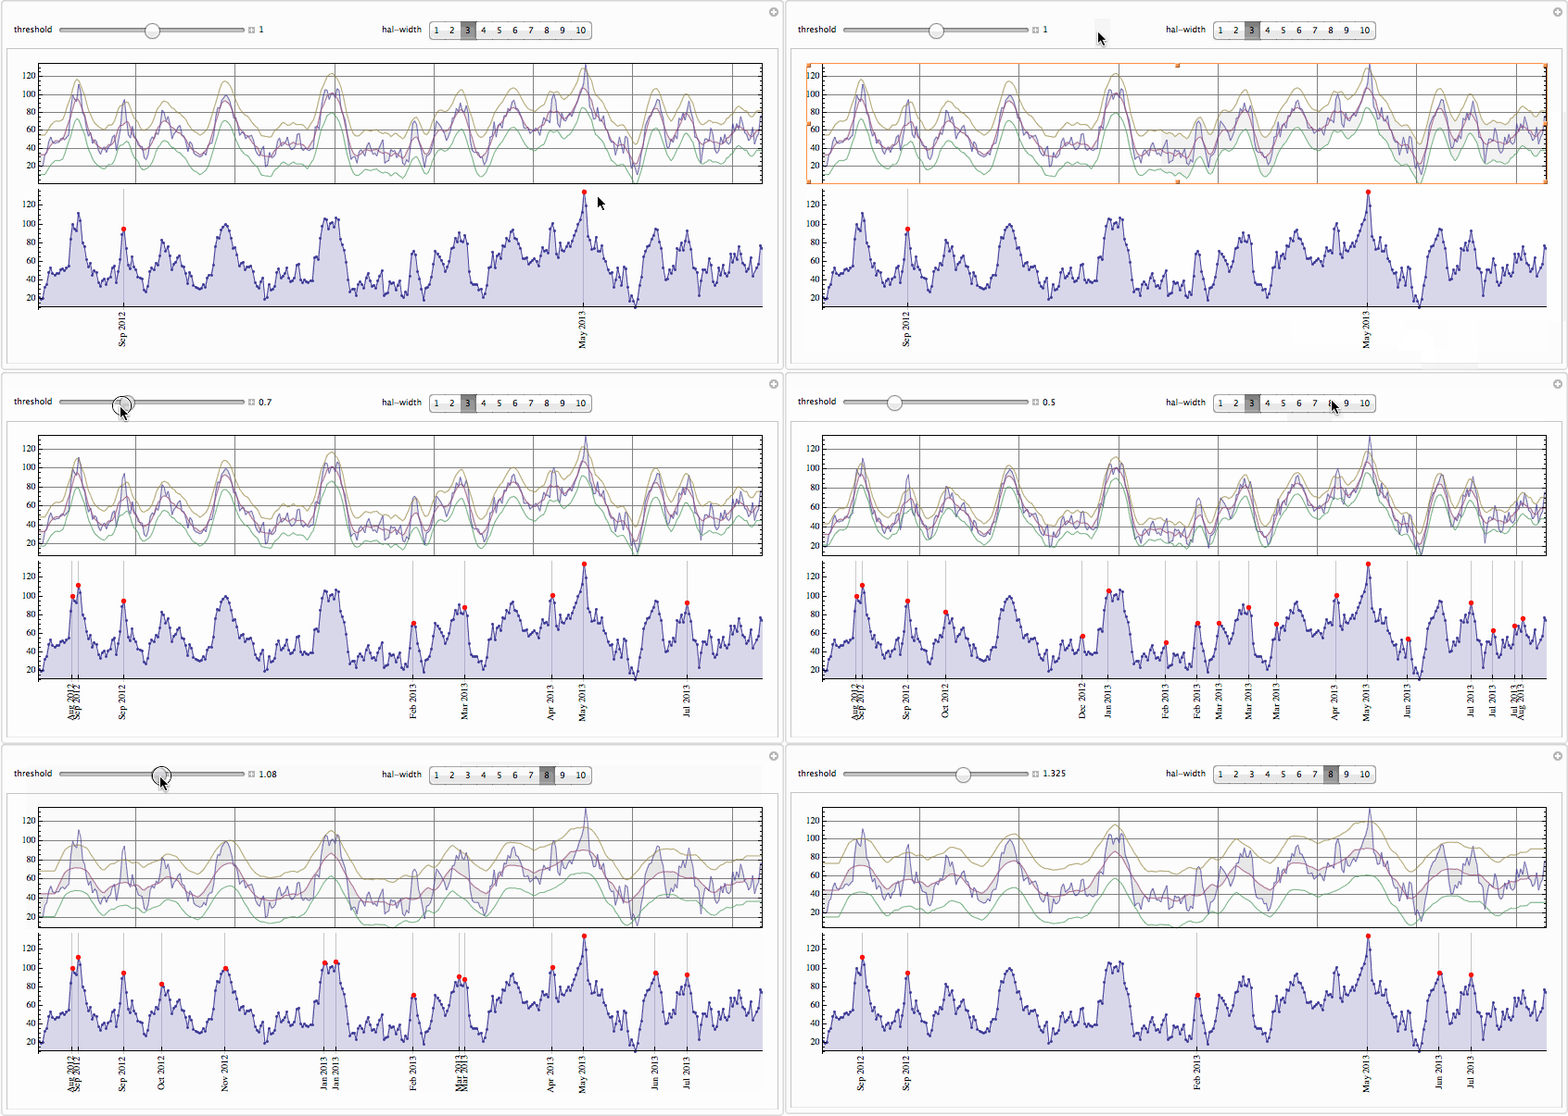
We right away found on May 2013 mark - a
most powerful recent event described in Wikipedia page here. Please let me know if you have suggestions how to speed this up or improve it generally. I would be very curious to know your opinion and critique.
The .GIF below is large - wait till it is loaded.
The following reference could be useful:
The code for the interactive app:
Manipulate[
tt = {#,
Rotate[DateString[#, {"MonthNameShort", " ", "Year"}], Pi/2]} & /@
Pick[raw, PeakDetect[data, wid, thr StandardDeviation[data]], 1][[
All, 1]];
Column[{
ListLinePlot[{data,
ArrayPad[MovingAverage[data, 1 + 2 wid], wid, "Fixed"],
ArrayPad[MovingAverage[data, 1 + 2 wid], wid, "Fixed"] +
thr StandardDeviation[data],
ArrayPad[MovingAverage[data, 1 + 2 wid], wid, "Fixed"] -
thr StandardDeviation[data]}, AspectRatio -> 1/6,
ImageSize -> 800, Filling -> {2 -> {1}, 3 -> {4}},
FrameTicks -> {None, Automatic},
FillingStyle -> {Directive[Red, Opacity[.7]],
Directive[Blue, Opacity[.7]], Directive[Gray, Opacity[.1]]},
PlotStyle -> Opacity[.7], PlotRange -> All, Frame -> True,
GridLines -> Automatic, PlotRangePadding -> 0],
Show[
DateListPlot[raw, Joined -> True, AspectRatio -> 1/6,
ImageSize -> 800, Filling -> Bottom, Ticks -> {tt, Automatic},
Frame -> False, Mesh -> All, PlotRange -> All],
DateListPlot[
If[# == {}, raw[[1 ;; 2]], #, #] &[
Pick[raw, PeakDetect[data, wid, thr StandardDeviation[data]],
1]], AspectRatio -> 1/6, ImageSize -> 800,
PlotStyle -> Directive[Red, PointSize[.007]], PlotRange -> All]
, PlotRangePadding -> {0, Automatic}]
}],
Row[{
Control[{{thr, 1, "threshold"}, 0, 2, Appearance -> "Labeled"}],
Spacer[100],
Control[{{wid, 3, "hal-width"}, 1, 10, 1, Setter}]
}]
]
============== UPDATE =================Thank you all very much for contributing. I collected everyone's efforts and Danny's two functions in a single completely compile-able expression which seems to give shortest time; - but just vaguely faster then Danny's ingenious maneuver. I very much liked format suggested by Christopher, the one that Michael also kept in his packages. But I wanted to make some benchmarking and thus followed the format returned by the function
MaxDetect - simply for the sake of speed comparison. This format is just a binary list of the length of original data with 1s in positions of found peaks.
Here is the function:
PeakDetect =
Compile[{{data, _Real, 1}, {width, _Integer}, {cut, _Real}},
(Table[0, {width}]~Join~
UnitStep[
Take[data, {1 + width, -1 - width}] -
(Module[{tot = Total[#1[[1 ;; #2 - 1]]], last = 0.},
Table[tot = tot + #1[[j + #2]] - last;
last = #1[[j + 1]];
tot, {j, 0, Length[#1] - #2}]]/#2) &[data, 1 + 2 width] - cut]
~Join~Table[0, {width}]) ({0}~Join~
Table[If[Sign[{data[[ii + 1]] - data[[ii]],
data[[ii + 2]] - data[[ii + 1]]}] == {1, -1}, 1, 0],
{ii, 1, Length[data] - 2}]~Join~{0}), CompilationTarget -> "C"];
dat = RandomReal[1, 10^7];
pks = MaxDetect[dat]; // AbsoluteTiming
Total[pks]
(* ======== output ========
{62.807928, Null}
3333361
======== output ======== *)
pks = PeakDetect[dat, 1, 0]; // AbsoluteTiming
Total[pks]
(* ======== output ========
{1.560074, Null}
3333360
======== output ======== *)
And here are the speed benchmarks on 10 million data points which shows 40 times speed-up: