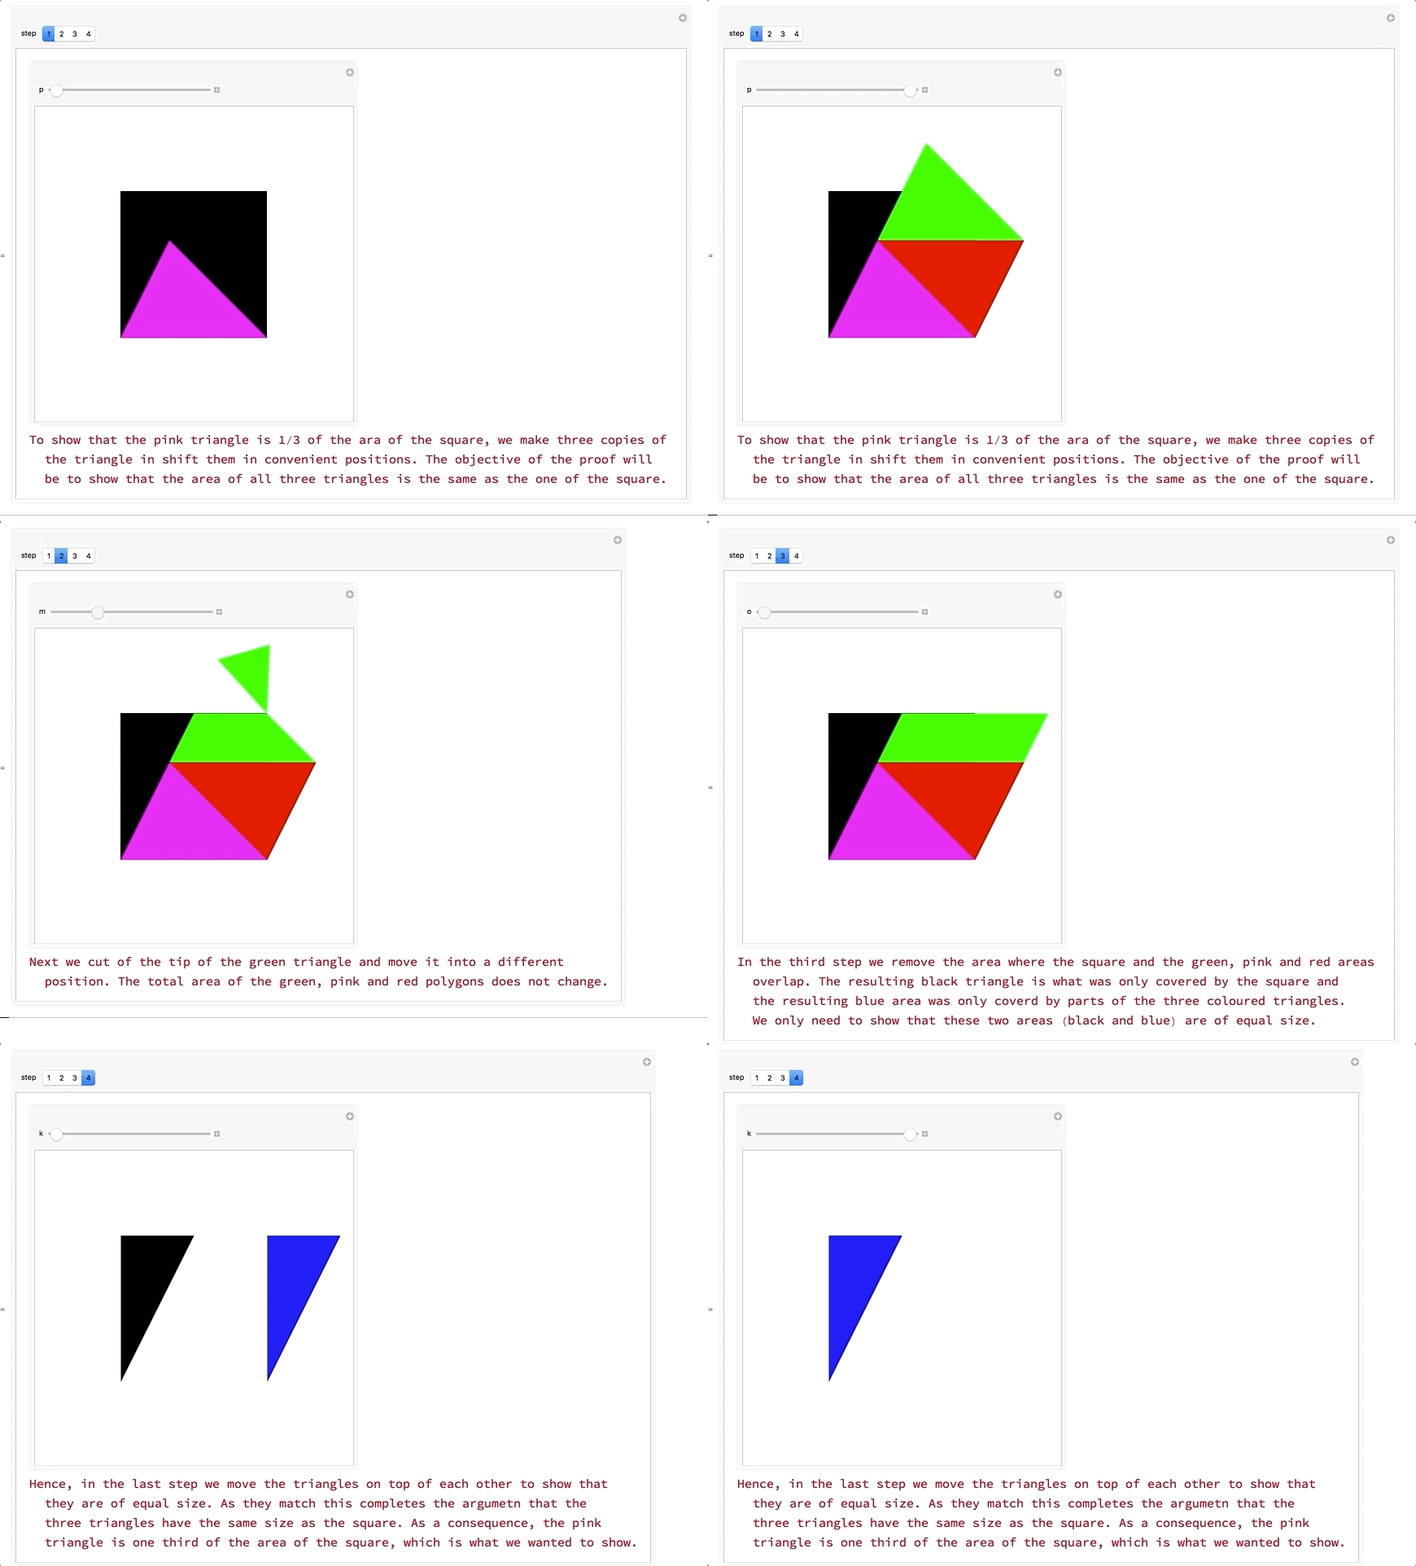
In terms of "computational" we could try to make Ed's proof into a little interactive experience (the video is too fast, but you can easily try the code below!):

You need to work your way through steps one to 4 and always move the slider appropriately from left to right.
(*From the documentation*)
SymmetricSubdivision[Triangle[pl_], k_] /; 0 <= k < 2^Length[pl] :=
 Module[{n = Length[pl] - 1, i0, bl, pos},
  i0 = DigitCount[k, 2, 1]; bl = IntegerDigits[k, 2, n];
  pos = FoldList[If[#2 == 0, #1 + {0, 1}, #1 + {1, 0}] &, {0, i0},
    Reverse[bl]];
  Triangle@Map[Mean, Extract[pl, #] & /@ Map[{#} &, pos + 1, {2}]]
  ]

(*The magic Manipulate*)

Manipulate[
 Which[step == 1,
  Column[{Manipulate[
     Graphics[{Rectangle[{0, 0}, {1, 1}], RGBColor[
       0.9960635289608001, 0.12544040437828788`, 0.9997459270575916],
       Triangle[{{0, 0}, {1, 0}, {1/3, 2/3}}],
       Blend[{RGBColor[
         0.9960635289608001, 0.12544040437828788`,
          0.9997459270575916], Green}, p],
       Triangle[{{0, 0} + p {1/3, 2/3}, {1, 0} +
          p {1/3, 2/3}, {1/3, 2/3} + p {1/3, 2/3}}],
       Blend[{RGBColor[
         0.9960635289608001, 0.12544040437828788`,
          0.9997459270575916], Red}, p],
       Translate[
        GeometricTransformation[
         Triangle[{{0, 0}, {1, 0}, {1/3, 2/3}}],
         RotationTransform[Pi p]], p {1 + 1/3, 2/3}]},
      PlotRange -> {{-0.5, 1.5}, {-0.5, 1.5}}], {p, 0, 1}],
    Style["To show that the pink triangle is 1/3 of the area of the \
square, we make three copies of the triangle in shift them in \
convenient positions. The objective of the proof will be to show that \
the area of all three triangles is the same as the one of the \
square.", 15, Red]}], step == 2,
  Column[{Manipulate[
     Graphics[{Rectangle[{0, 0}, {1, 1}], RGBColor[
       0.9960635289608001, 0.12544040437828788`, 0.9997459270575916],
       Triangle[{{0, 0}, {1, 0}, {1/3, 2/3}}],
       Green, {GeometricTransformation[#[[4]],
           RotationTransform[-m Pi, {1,
             1}]], #[[1]], #[[2]], #[[3]]} &@(SymmetricSubdivision[
            Triangle[{{0, 0} + {1/3, 2/3}, {1, 0} + {1/3, 2/3}, {1/3,
                2/3} + {1/3, 2/3}}], #] & /@ Range[0, 3]), Red,
       Translate[
        GeometricTransformation[
         Triangle[{{0, 0}, {1, 0}, {1/3, 2/3}}],
         RotationTransform[Pi ]], {1 + 1/3, 2/3}]},
      PlotRange -> {{-0.5, 1.5}, {-0.5, 1.5}}], {m, 0, 1}],
    Style["Next we cut of the tip of the green triangle and move it \
into a different position. The total area of the green, pink and red \
polygons does not change.", 15, Red]}], step == 3,
  Column[{Manipulate[
     Graphics[{Opacity[o], Rectangle[{0, 0}, {1, 1}], RGBColor[
       0.9960635289608001, 0.12544040437828788`, 0.9997459270575916],
       Triangle[{{0, 0}, {1, 0}, {1/3, 2/3}}],
       Green, {GeometricTransformation[#[[4]],
           RotationTransform[- Pi, {1,
             1}]], #[[1]], #[[2]], #[[3]]} &@(SymmetricSubdivision[
            Triangle[{{0, 0} + {1/3, 2/3}, {1, 0} + {1/3, 2/3}, {1/3,
                2/3} + {1/3, 2/3}}], #] & /@ Range[0, 3]), Red,
       Translate[
        GeometricTransformation[
         Triangle[{{0, 0}, {1, 0}, {1/3, 2/3}}],
         RotationTransform[Pi ]], {1 + 1/3, 2/3}], Opacity[1 - o],
       Black, Triangle[{{0, 0}, {1/2, 1}, {0, 1}}], Blue,
       Triangle[{{1, 0}, {1 + 1/2, 1}, {1, 1}}]},
      PlotRange -> {{-0.5, 1.5}, {-0.5, 1.5}}], {o, 1, 0}],
    Style["In the third step we remove the area where the square and \
the green, pink and red areas overlap. The resulting black triangle \
is what was only covered by the square and the resulting blue area \
was only coverd by parts of the three coloured triangles. We only \
need to show that these two areas (black and blue) are of equal \
size.", 15, Red]}], step == 4,
  Column[{Manipulate[
     Graphics[{Triangle[{{0, 0}, {1/2, 1}, {0, 1}}], Blue,
       Triangle[{{1, 0} - k {1, 0}, {1 + 1/2, 1} - k {1, 0}, {1, 1} -
          k {1, 0}}]}, PlotRange -> {{-0.5, 1.5}, {-0.5, 1.5}}], {k,
      0, 1}], Style[
     "Hence, in the last step we move the triangles on top of each \
other to show that they are of equal size. As they match this \
completes the argument that the three triangles have the same size as \
the square. As a consequence, the pink triangle is one third of the \
area of the square, which is what we wanted to show.", 15,
     Red]}]], {step, {1, 2, 3, 4}}]
This is still not computational thinking but it might help students/pupils to better grasp the idea of the proof that Ed has described.
I'd love to hear your comments.
Cheers,
Marco
PS: Notebook attached.
 Attachments: