Please Download the attached notebook at the end of the discussion

@xponential is a popluar visual aritist on twitter. I found one of his/her masterpiece very appealing and I want to give it a try in Wolfram Language. The replication above is generated solely with the code below and in the attached notebook. The scale of the width of the vertical striple to the thickness of annuli is estimated from the origin work.
Know-how
The key components in the animation are
The key operations are
Every frame is compose of irregular shape of tiles. The black tiles are computed and the white ones are simply void, bounded by its black tile neighbours.
The interesting visual affect of each frame can be further divided into an array of vertial patterns. Black tiles aligned vertically are intersections of many annuli and a bar. The adjacent bars are designed to intesect with a different set of annuli, denoted by region1 and region2:
region1 =
  DiscretizeRegion /@ {
    Annulus[{0, 0}, {1, 2}],
    Annulus[{0, 0}, {3, 4}],
    Annulus[{0, 0}, {5, 6}],
    Annulus[{0, 0}, {7, 8}],
    Annulus[{0, 0}, {9, 10}],
    Annulus[{0, 0}, {11, 12}]
 };
Of course you can find a easy way to generate the above with Table or Map functions. Similarly, region2 is defined as
region2 =
  DiscretizeRegion /@ {
    Disk[],
    Annulus[{0, 0}, {2, 3}],
    Annulus[{0, 0}, {4, 5}],
    Annulus[{0, 0}, {6, 7}],
    Annulus[{0, 0}, {8, 9}],
    Annulus[{0, 0}, {10, 11}],
    Annulus[{0, 0}, {12, 13}]
 };
Run these codes to illustrate the alternating bulleyes:
n=9;opt=PlotRange->{{-n,n},{-n,n}};
g1=Graphics[MeshPrimitives[#,2]&/@region1,opt];
g2=Graphics[MeshPrimitives[#,2]&/@region2,opt];
ListAnimate@Flatten@Riffle[ConstantArray[g1,10],{ConstantArray[g2,10]},10]

The tiling on two adjacent bars are generated by
With[{k = 0.9}, Graphics[
   (MeshPrimitives[RegionIntersection[
         Rectangle[{k, -12}, {k + 1.2, 12}], #], 2] & /@ region1)
    ~Join~
    (MeshPrimitives[RegionIntersection[
         Rectangle[{k - 1.2, -12}, {k, 12}], #], 2] & /@ region2)
   , PlotRange -> {-9, 9}]
  ] // Rotate[#, 90 Degree] &
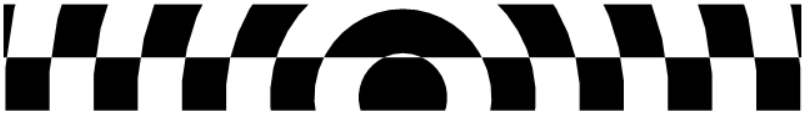
( I rotate the tile 90 degree to have it better fit into this webpage )
Because I am not doing any furtuer hefty operations based on the regions, I use MeshPrimitives to convert these regions into simple polygons. Then I use Graphics display all items in a panel. RegionUnion should not be used here to save computation time.
In the demo above I use only two vertical bars. To accomodate more bars in a similar computation, I declared the following function:
findMosaics[rect_, rings_] :=
 With[{objs =
    DeleteCases[RegionIntersection[rect, #] & /@ rings, _EmptyRegion]},
  MeshPrimitives[#, 2] & /@ objs]
It picks a bar and map an Intersection function all over the list of annuli in either region1 or region2. The returned values are converted to simple graphics object. Ready to be used in the next round!
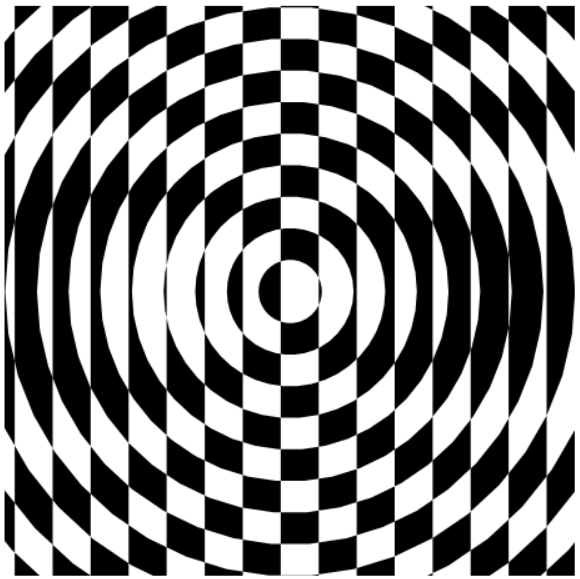
Riffle the annuli into alternating patter. Then generate a single frame
rings = Riffle[ConstantArray[r2, 20], ConstantArray[r3, 20]][[;; 31]];
frame1 = With[{k = 0.9},
   rects =
    Table[Rectangle[{k + i*1.2, -12}, {k + (i + 1)*1.2, 12}], {i, -15,
       15}];
   MapThread[findMosaics, {rects, rings}]
   ];
  Graphics[frame1, PlotRange -> {{-9, 9}, {-9, 9}}]
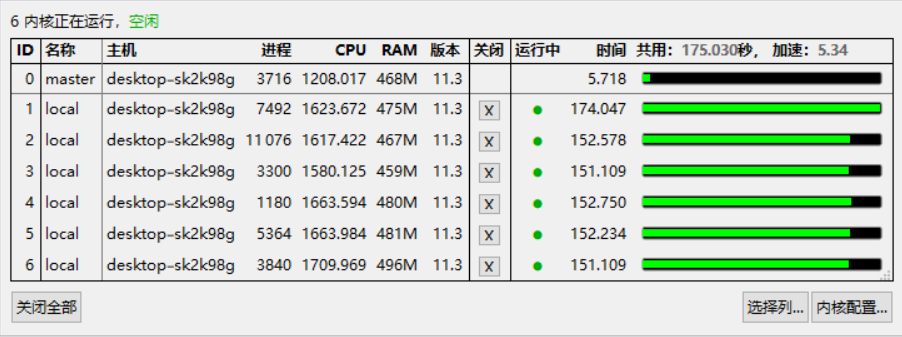
Use Table or Map to generate more frames. The parallel version is handy in this case as well:
In[92]:= LaunchKernels[]
Out[92]= {KernelObject[1,local],KernelObject[2,local],KernelObject[3,local],KernelObject[4,local],KernelObject[5,local],KernelObject[6,local]}

frames = ParallelTable[
   With[{k = step},
    rects =
     Table[Rectangle[{k + i*1.2, -12}, {k + (i + 1)*1.2,
        12}], {i, -15, 15}];
    Graphics[MapThread[findMosaics, {rects, rings}],
     PlotRange -> {{-9, 9}, {-9, 9}}]
    ],
   {step, -1.2, 1.2, 0.08}, Method -> "FinestGrained"];
I observe very even loads on subkernels with embarrassing parallelism.
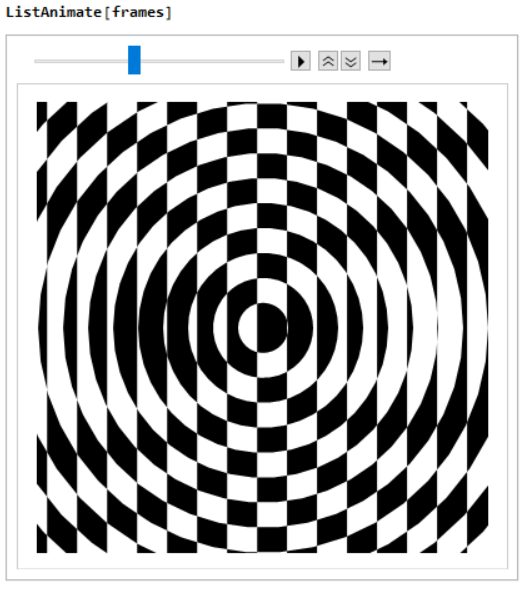
Finally, I inspect the animation in notebook with ListAnimate before Export["animation.gif", frames] :
Beyond the original concentric circles
Wolfram Language's versatility is top notch. Once you learn by heart the code above, you can create more fancy art with in-house polygon data. Simply call the following NLP or W|A query
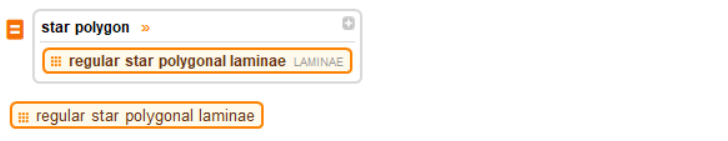
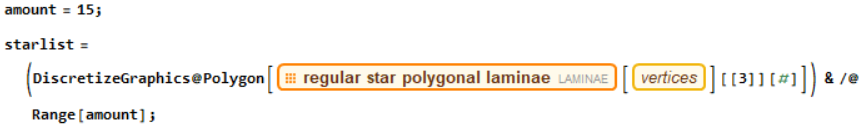
Create 15 "concentric" {5,2}-star rings, include the solid one at the center:
root=starlist[[1]];
regions=Prepend[ListConvolve[{0,0},Rest@starlist,1,root,#2&,RegionDifference[#2,#1]&],root];
(*the effect is {star1,star2,star3 ... } => {RegionDiff[star2,star1], RegionDiff[star3,star2]... }*)
where RegionDifference is an instance of the more general set difference operation. ListConvolve used in the form is a good template to do neibourbood operation in functional programming style.
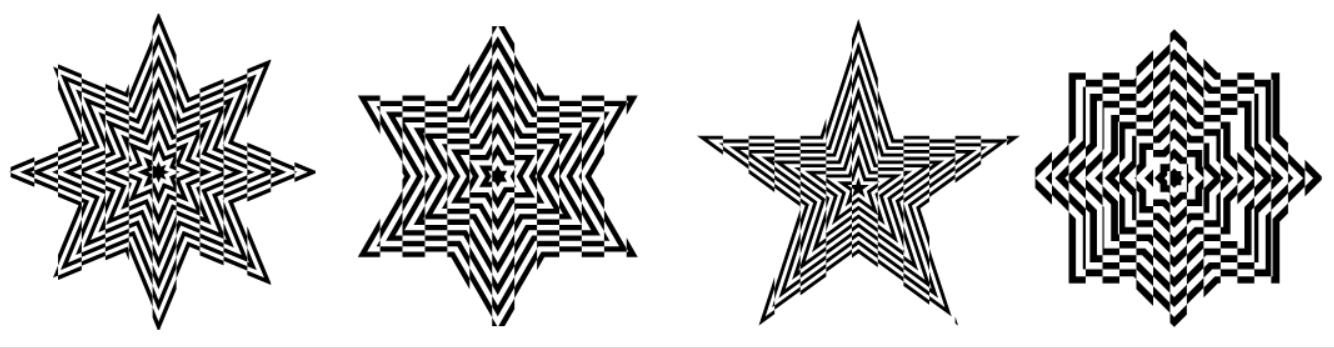
Again, use the code in alternating annuli to observe the same pattern for star-shape rings:

Use the same code that generates single frame in the first case to these star-shaped rings. Well, as a bonus, let me apply this function to all star polygon available ( Proposal for Computational Tatoo) :
Use the same code with ParallelTable to generate animation:

About @xponential and @AkiyoshiKitaoka
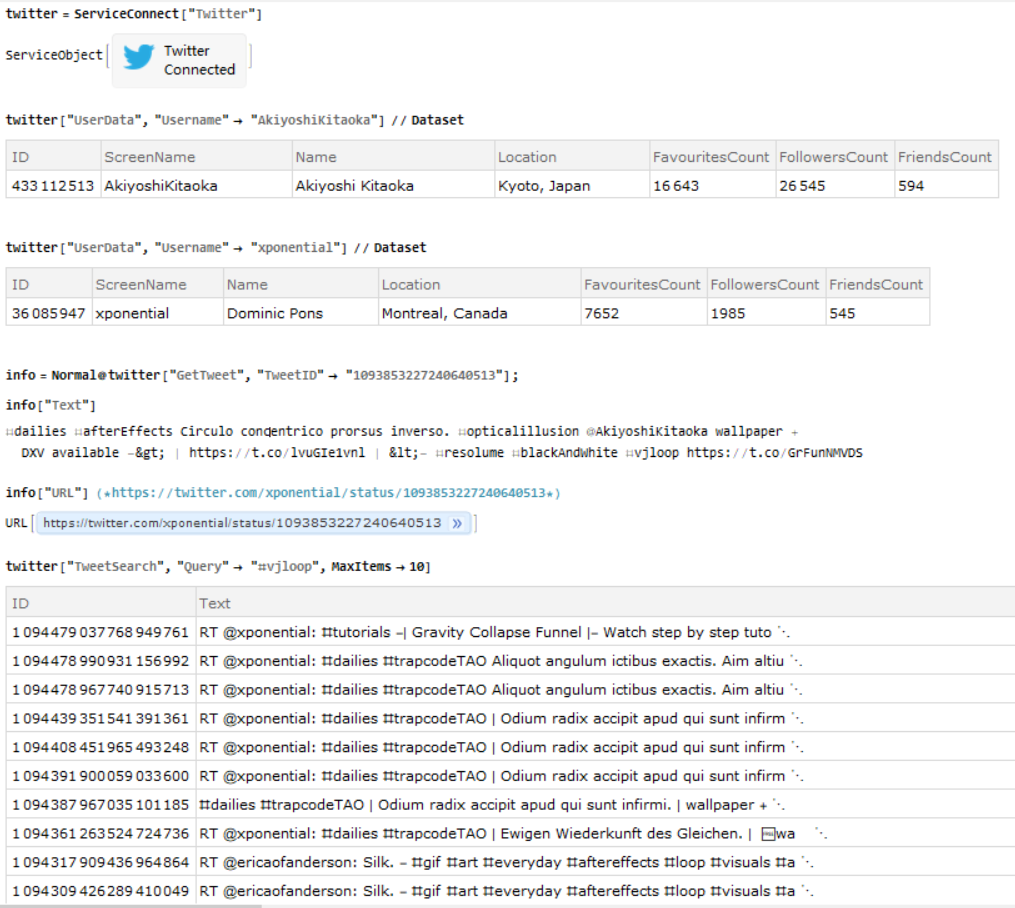
Assume you have a valid twitter account, download the attached notebook and use ServiceConnect to find more about visual artist @xponential and @AkiyoshiKitaoka their cyber art gallery:
twitter = ServiceConnect["Twitter"]
twitter["UserData", "Username" -> "AkiyoshiKitaoka"] // Dataset
twitter["UserData", "Username" -> "xponential "] // Dataset
That's all I want to share in this discussion. Enjoy coding ~
 Attachments:


