Dear All,
that is indeed interesting. I also believe that the exact distribution is unknown but it can be approximated by a GammaDistribution, see:
https://arxiv.org/pdf/1207.0608.pdf
https://arxiv.org/pdf/1612.02375.pdf
https://www.sciencedirect.com/science/article/pii/002608008990030X
http://www.scipress.org/journals/forma/pdf/1804/18040221.pdf
http://www.eurecom.fr/~arvanita/PVT.pdf
Interestingly, if you run the code in @Vitaliy Kaurov's cod for 50000 points you obtain:
dis = FindDistribution[areas]
(*GammaDistribution[3.2718, 0.0000197063]*)
I managed to get it done for 500000 points. I think that the edge effects should be getting smaller; as the area increases faster than the circumference.
So I obtain:
dis = FindDistribution[areas, 5]

(*
{MixtureDistribution[{0.658342, 0.341658}, {MaxwellDistribution[2.92588*10^-6], GammaDistribution[7.1867, 1.37091*10^-6]}],

ExtremeValueDistribution[4.80446*10^-6, 2.73831*10^-6],

GammaDistribution[2.94963, 2.17794*10^-6],

BetaDistribution[2.94962, 459143.],

MixtureDistribution[{0.687855, 0.312145}, {MaxwellDistribution[2.82857*10^-6],
   LogNormalDistribution[-11.5031, 0.28619]}]}*)
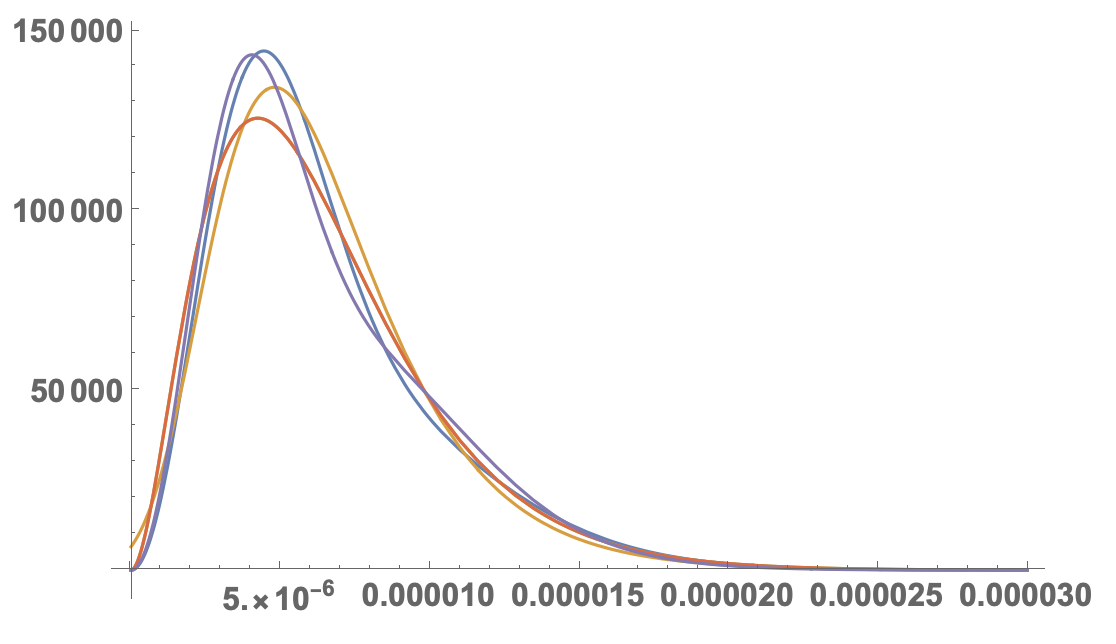
This happens when we plot all of them:
Plot[Evaluate[PDF[#, x] & /@ dis], {x, 0, 0.00003}, PlotRange -> All, LabelStyle -> Directive[Bold, 16]]
If you compare that with the histogram:
Show[Histogram[areas, 200, "PDF"], Plot[Evaluate[PDF[#, x] & /@ dis], {x, 0, 0.00003}, PlotRange -> All,LabelStyle -> Directive[Bold, 16]]]
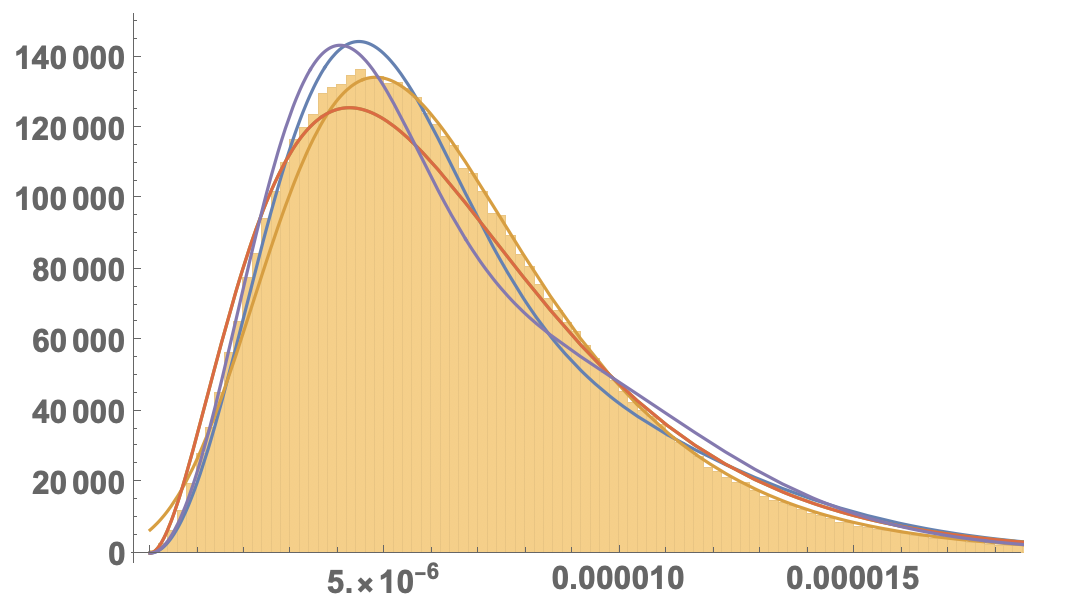
I would say that the second (ExtremeValueDistribution) fits best:
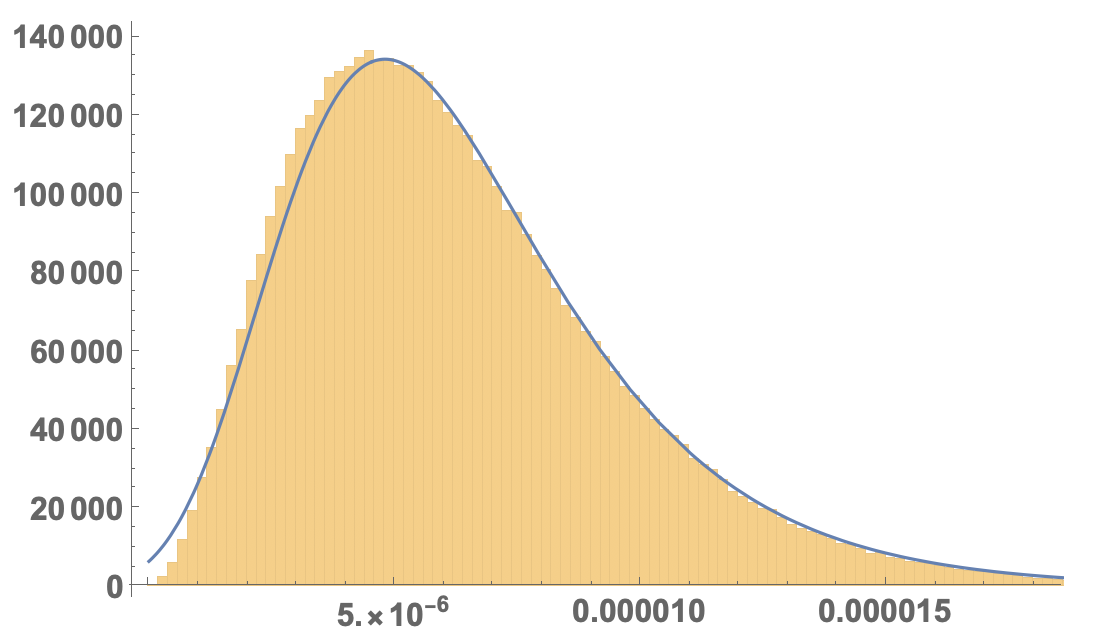
but it does not get the small areas quite right.
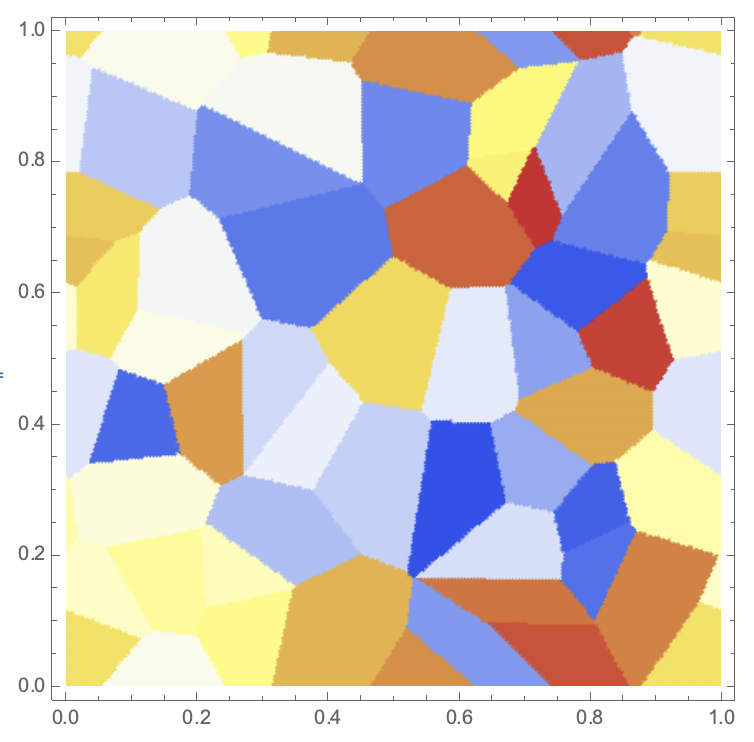
Regarding the boundary effects, one might also (similar to what Sander suggests) use the torus as the geometry:
disfun[x_, y_] := Sqrt[Min[Abs[x[[1]] - y[[1]]], 1 - Abs[x[[1]] - y[[1]]]]^2 + Min[Abs[x[[2]] - y[[2]]], 1 - Abs[x[[2]] - y[[2]]]]^2]

M = 50; nf = Nearest[Rule @@@ Transpose[{RandomReal[1, {M, 2}], Range[M]}], DistanceFunction -> disfun]

DensityPlot[First[nf[{x, y}]], {x, 0, 1}, {y, 0, 1}, PlotPoints -> 100, ColorFunction -> "TemperatureMap"]
Cheers,
Marco


