Message Boards Message Boards

1
|
8685 Views
|
4 Replies
|
6 Total Likes
View groups...
Share
Share this post:

What are there discontinuities in the plot?

Posted 10 years ago

When I create a piecewise function as shown in the graph and plot it, there will be some discontinuities. But if I use "/." rule to show the value of some point of the discontinuities, it does give the right answer. Is this a bug?

Plot with discontinuities

POSTED BY: Seasong Zhang
4 Replies

I would not use Which to enter mathematical functions, as it's primarily meant for programming and not for representing mathematical objects (though the line between these is often blurry in Mathematica). This means that functions that deal with symbolic math are often aware of Piecewise, but they don't always know about Which (a few do).

Now, why are there holes in the plot? This is not a bug, it's a feature ;-) ... gone slightly wrong.

Plot does some symbolic processing on functions to detect discontinuities, and it will not plot the function there. Try these two inputs:

Plot[HeavisideTheta[x - 3], {x, 0, 6}]

and

ht[x_?NumericQ] := HeavisideTheta[x]
Plot[ht[x - 3], {x, 0, 6}]

Mathematica know that HeavisideTheta has a discontinuity and avoids drawing a line there when plotting. This behaviour is preferable in many situations, especially when plotting 2D functions (think e.g. branch cuts).

ht is defined in a way to hide its internals from Plot so it can't detect the discontinuity using symbolic methods.

Mathematica generally assumes that Piecewise might have a discontinuity at each break and does not go to the trouble to check whether you specified the Piecewise in a way as to avoid jumps. This is why you see the holes.

To turn off the feature, use the option Exclusions -> None. To read more, look up Exclusions.

It may be a better option to use ExclusionsStyle -> Automatic which doesn't turn off discontinuity detection (which can aid the adaptive plotting and result in better quality plots), just draws the gaps with the same style as the rest of the plot.

POSTED BY: Szabolcs Horvát

Hi,

I guess that you can see the problem when you use the option Mesh-> All.

f[t_] := Piecewise[{{0, t <= 0}, {0.2 t^3, 
    0 < t <= 0.5}, {0.025 + 0.15*(-1 t + 2 t^2), 
    0.5 < t <= 2.5}, {3.15 - 0.6 (6.5 t - 3 t^2 + 1/3*t^3), 
    2.5 < t <= 3}, {-2.25 + 1.5 t, 
    3 < t <= 5}, {22.75 - 13.5 t + 3 t^2 - 0.2 t^3, 
    5 < t <= 5.5}, {-10.525 + 4.65 t - 0.3 t^2, 
    5.5 < t <= 7.5}, {-94.9 + 38.4 t - 4.8 t^2 + 0.2 t^3, 
    7.5 < t <= 8}, {7.5, True}}]

and

Plot[f[t], {t, 0, 8}, Mesh -> All]

gives

enter image description here

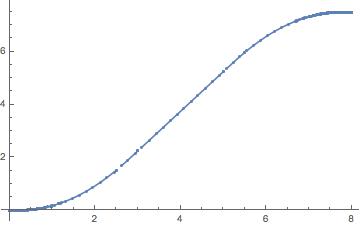
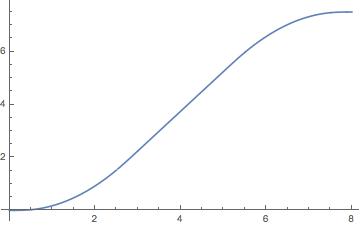
You can plot more points and the problem is remedied:

Plot[f[t], {t, 0, 8}, PlotPoints -> 200]

enter image description here

Here is the implementation with Which that indeed does not cause any trouble in the first place:

g[t_] := Which[t <= 0, 0, 0 < t <= 0.5, 0.2 t^3, 0.5 < t <= 2.5, 
  0.025 + 0.15*(-1 t + 2 t^2), 2.5 < t <= 3, 
  3.15 - 0.6 (6.5 t - 3 t^2 + 1/3*t^3), 3 < t <= 5, -2.25 + 1.5 t, 
  5 < t <= 5.5, 22.75 - 13.5 t + 3 t^2 - 0.2 t^3, 
  5.5 < t <= 7.5, -10.525 + 4.65 t - 0.3 t^2, 
  7.5 < t <= 8, -94.9 + 38.4 t - 4.8 t^2 + 0.2 t^3, True, 7.5]

Cheers,

M.

POSTED BY: Marco Thiel

The problem doesn't seem to occur if you use the Which construction to define the function:

test:=Which[t?0,0,0<t?.5,.2t^3, etc.
POSTED BY: S M Blinder
Posted 10 years ago

try add this option.

   Plot[f[t], {t, 0, 8}, Exclusions -> None]
POSTED BY: wayne wang
Reply to this discussion
Community posts can be styled and formatted using the Markdown syntax.
Reply Preview
Attachments
Remove
or Discard

Group Abstract Group Abstract