Group Abstract Group Abstract

Message Boards Message Boards

1
|
10.4K Views
|
4 Replies
|
6 Total Likes
View groups...
Share
Share this post:

What are there discontinuities in the plot?

Posted 11 years ago

When I create a piecewise function as shown in the graph and plot it, there will be some discontinuities. But if I use "/." rule to show the value of some point of the discontinuities, it does give the right answer. Is this a bug?

Plot with discontinuities

POSTED BY: Seasong Zhang
4 Replies
Posted 11 years ago
POSTED BY: wayne wang

Hi,

I guess that you can see the problem when you use the option Mesh-> All.

f[t_] := Piecewise[{{0, t <= 0}, {0.2 t^3, 
    0 < t <= 0.5}, {0.025 + 0.15*(-1 t + 2 t^2), 
    0.5 < t <= 2.5}, {3.15 - 0.6 (6.5 t - 3 t^2 + 1/3*t^3), 
    2.5 < t <= 3}, {-2.25 + 1.5 t, 
    3 < t <= 5}, {22.75 - 13.5 t + 3 t^2 - 0.2 t^3, 
    5 < t <= 5.5}, {-10.525 + 4.65 t - 0.3 t^2, 
    5.5 < t <= 7.5}, {-94.9 + 38.4 t - 4.8 t^2 + 0.2 t^3, 
    7.5 < t <= 8}, {7.5, True}}]

and

Plot[f[t], {t, 0, 8}, Mesh -> All]

gives
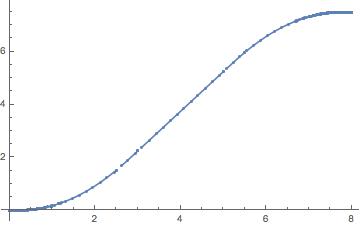
enter image description here

You can plot more points and the problem is remedied:

Plot[f[t], {t, 0, 8}, PlotPoints -> 200]
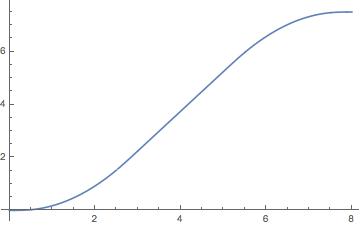
enter image description here

Here is the implementation with Which that indeed does not cause any trouble in the first place:

g[t_] := Which[t <= 0, 0, 0 < t <= 0.5, 0.2 t^3, 0.5 < t <= 2.5, 
  0.025 + 0.15*(-1 t + 2 t^2), 2.5 < t <= 3, 
  3.15 - 0.6 (6.5 t - 3 t^2 + 1/3*t^3), 3 < t <= 5, -2.25 + 1.5 t, 
  5 < t <= 5.5, 22.75 - 13.5 t + 3 t^2 - 0.2 t^3, 
  5.5 < t <= 7.5, -10.525 + 4.65 t - 0.3 t^2, 
  7.5 < t <= 8, -94.9 + 38.4 t - 4.8 t^2 + 0.2 t^3, True, 7.5]

Cheers,

M.

POSTED BY: Marco Thiel
POSTED BY: Szabolcs Horvát

The problem doesn't seem to occur if you use the Which construction to define the function:

test:=Which[t?0,0,0<t?.5,.2t^3, etc.
POSTED BY: S M Blinder
Reply to this discussion
Community posts can be styled and formatted using the Markdown syntax.
Reply Preview
Attachments
Remove
or Discard