Hi Everyone,
I also had the idea of using the documentation:
http://reference.wolfram.com/language/guide/AlphabeticalListing.html
It is easy to import all commands from that website:
helppages = Select[Import["http://reference.wolfram.com/language/guide/AlphabeticalListing.html", "Hyperlinks"], StringMatchQ[#, "http://reference.wolfram.com/language/ref/" ~~ __ ~~ ".html"] &];
The following function imports all the links to other functions in the "See Also" section. Please do not run this function to keep the load on Wolfram Inc's servers as low as possible. The data is attached below to this post. Sorry to Wolfram Inc for downloading all this, it was not a DoS attack :-)
Monitor[For[k = 1, k <= Length[helppages], k++, dummy = URLFetch[helppages[[k]]];
  AppendTo[links, helppages[[k]] \[DirectedEdge] "http://reference.wolfram.com/language/ref/" <> # <> ".html" & /@
     If[Length[StringSplit[dummy, "See Also"]] > 1, (StringSplit[StringJoin[StringSplit[StringSplit[StringSplit[StringSplit[dummy, "See Also"][[2]], "Related Guides"][[1]], "href=\""], "\"><span"]], {"/language/ref/", ".html"}][[2 ;; ;; 2]]), {}]]], N[k/Length[helppages]]]
It is a good idea to save the data:
Export["~/Desktop/MMA-funcs.txt", links]
The following lines work to import the data again from that file:
data = Import["~/Desktop/MMA-funcs.txt", "Plaintext"];
links = ToExpression@Delete[Delete[StringReplace[StringReplace[(# <> "]" & /@ (StringReplace[
          StringReplace[StringSplit[StringReplace[data, "}\n{" -> ","], "],"], {"{Directed" -> "Directed", "]}" -> "]"}],
          "]" ~~ ___ ~~ "Directed" -> "], Directed"])),  ",Directed" -> "Directed"], "]]" -> "]"], 17648], 17647]
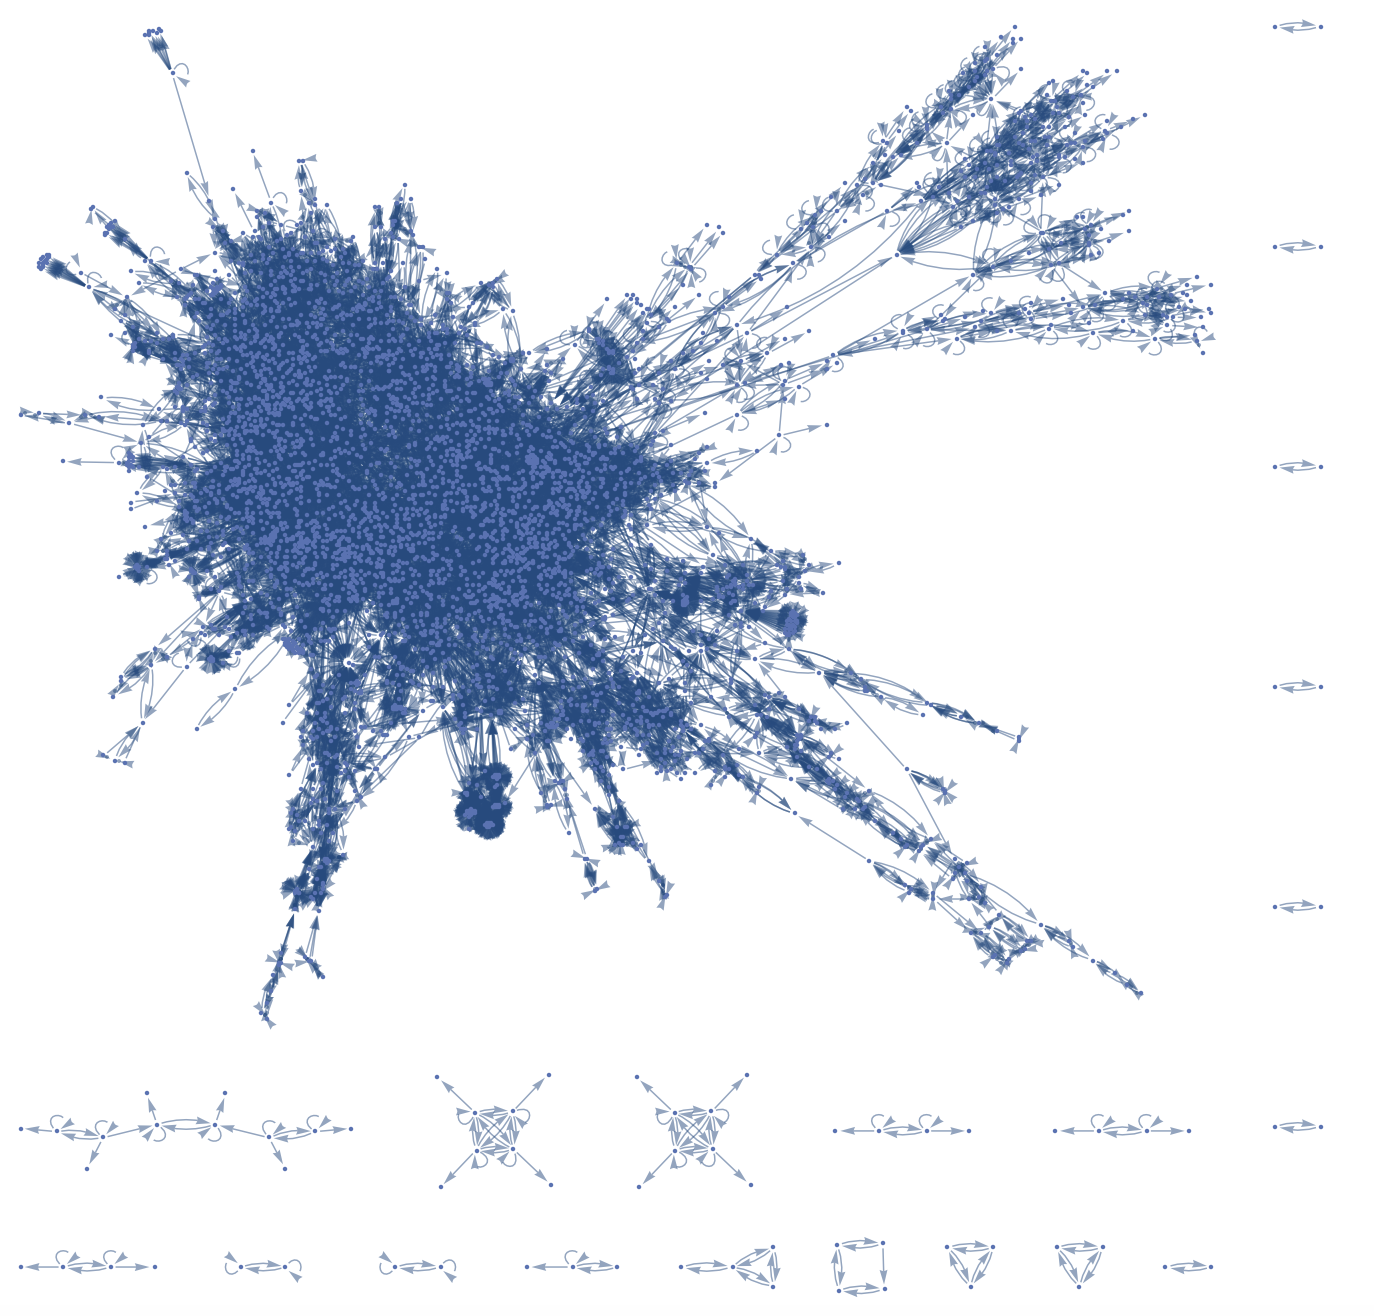
I will attach the txt-file to this post for everyone to play with. We can now graph the "relationship-graph" of all Mathematica functions.
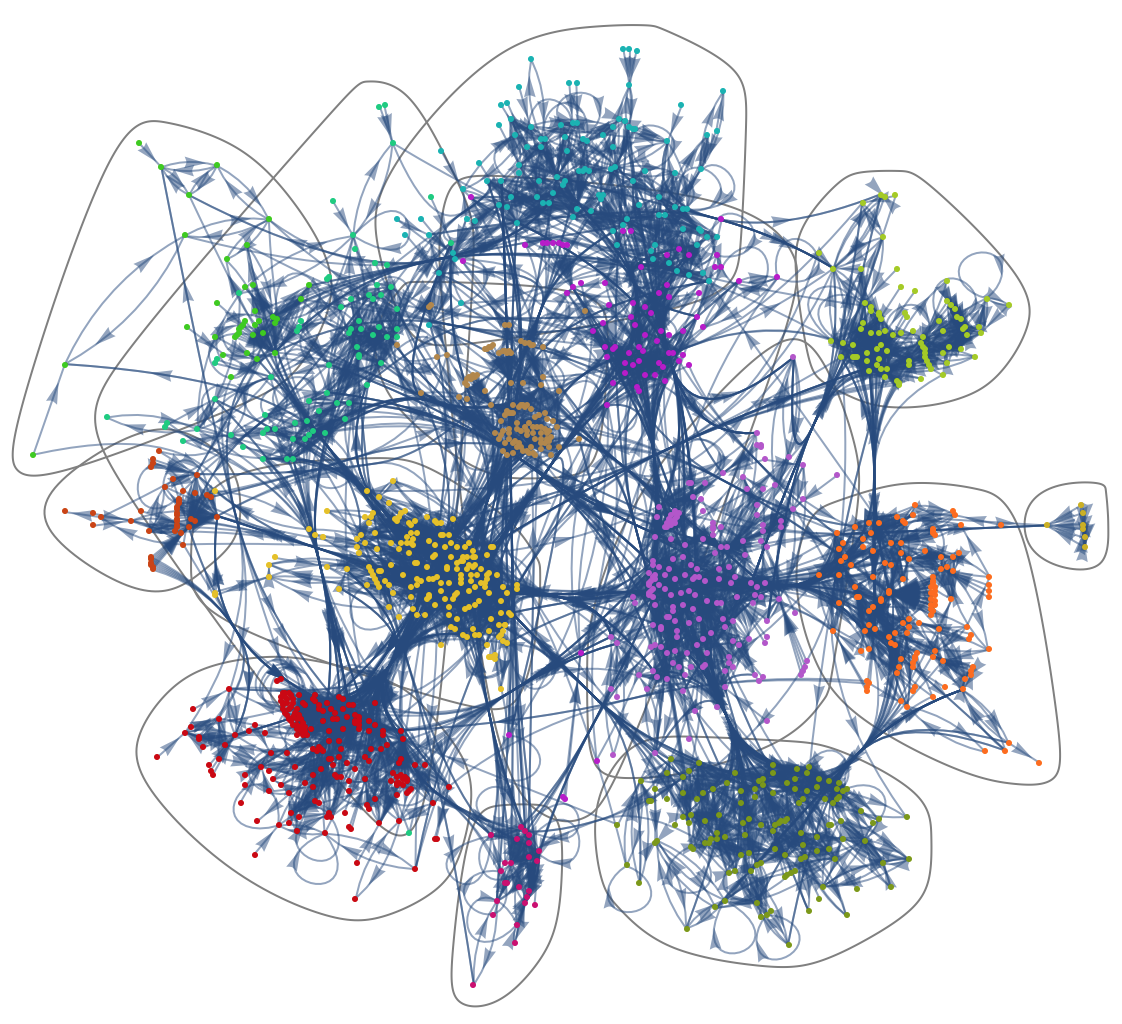
g = Graph[DeleteDuplicates[links]]
One interesting thing is to calculate the Communities:
communities = FindGraphCommunities[g];
We can look at a couple of the smaller ones to see whether the network makes intuitive sense:
Grid[Table[
  StringSplit[StringSplit[#, "ref/"][[2]], ".html"][[1]] & /@ communities[[k]], {k, -25, -1}], Frame -> All]
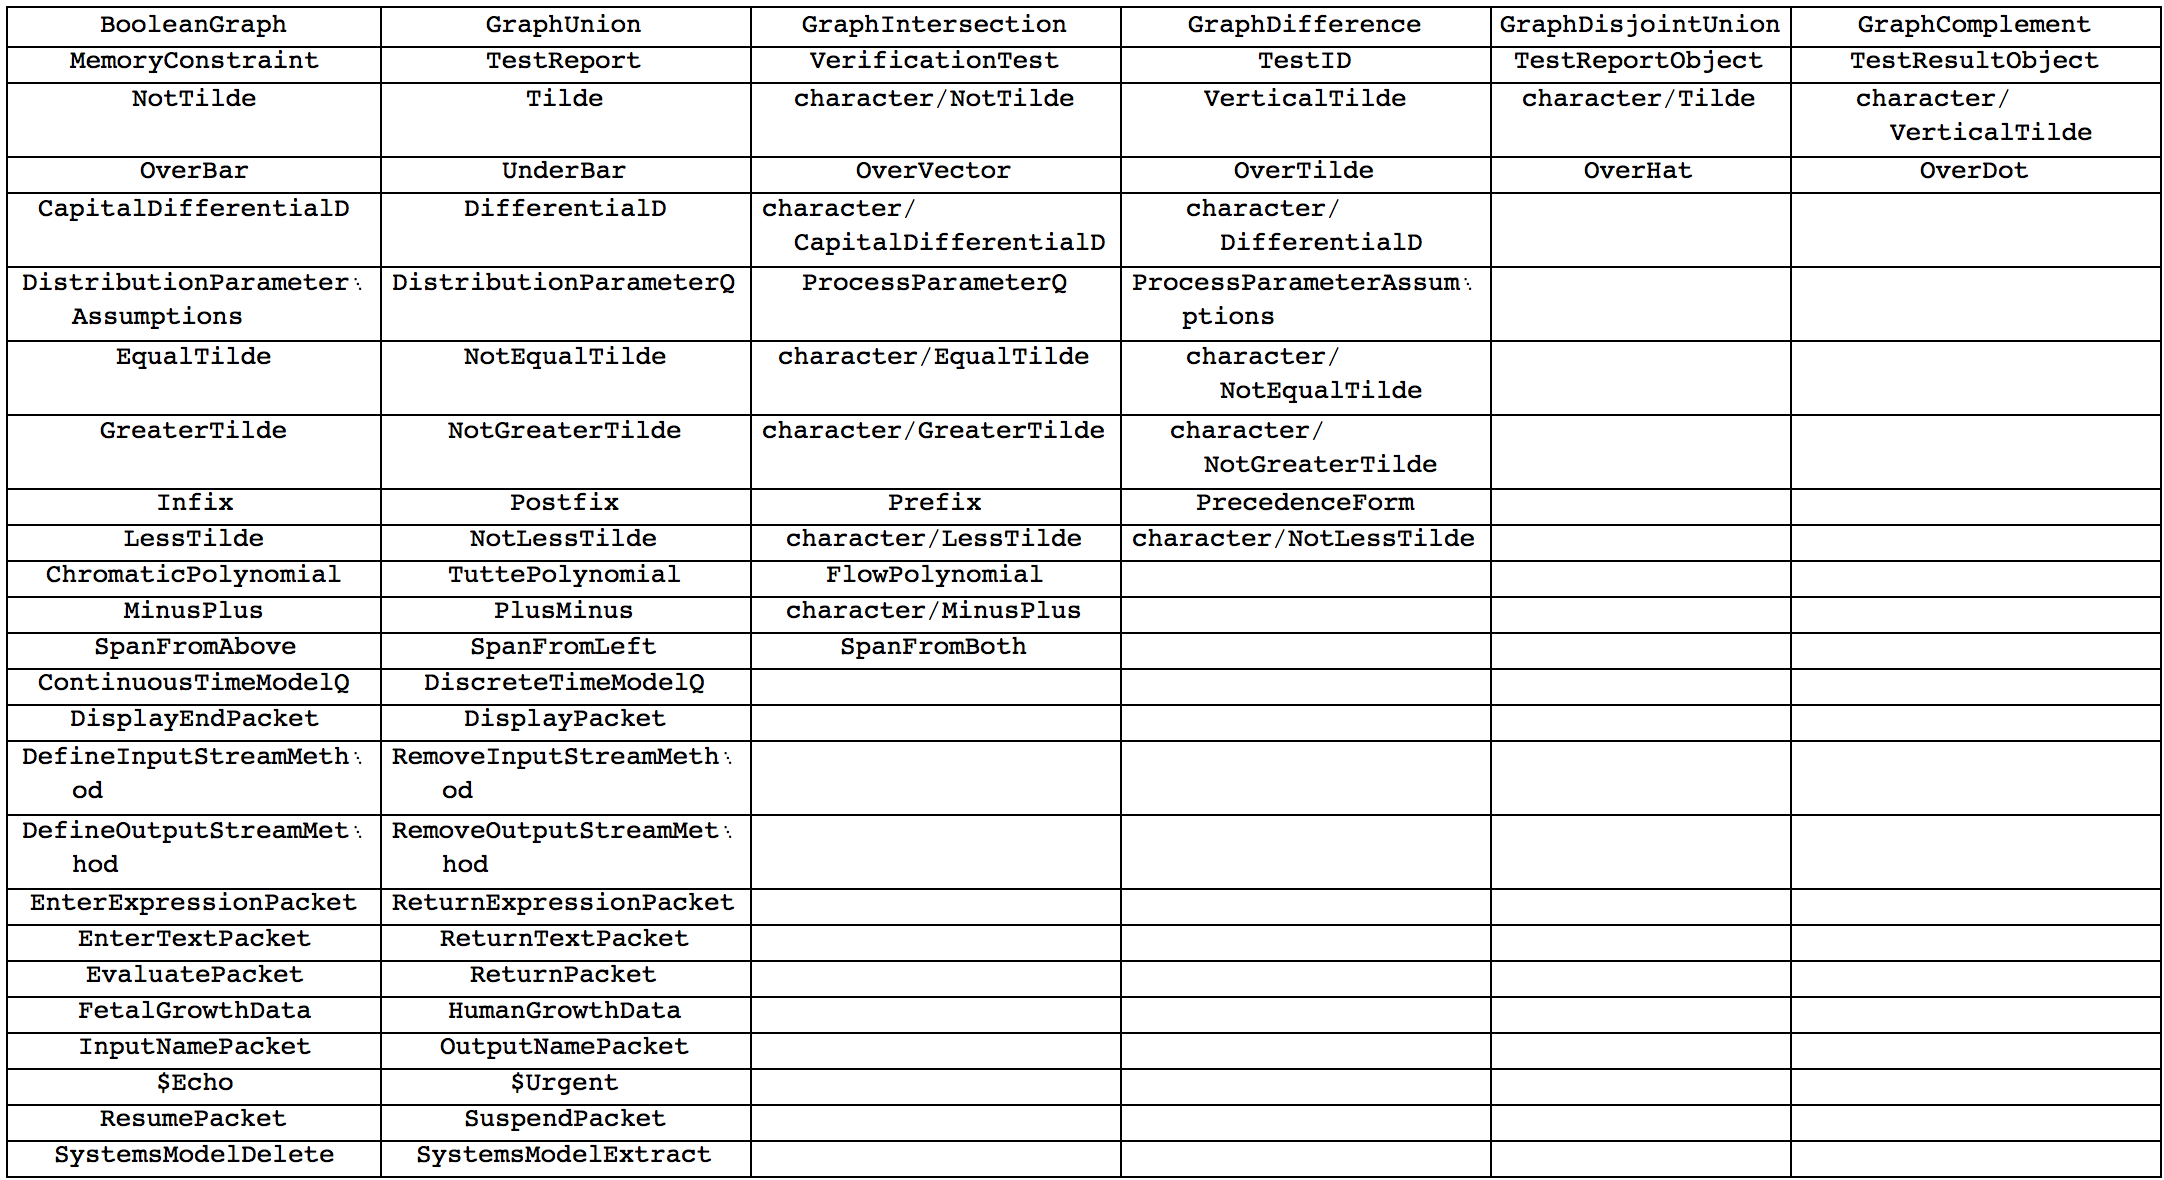
Every row corresponds to one community. It appears that the communities make sense. The first row for examples is related to Graph commands. We can also plot the CommunityGraph:
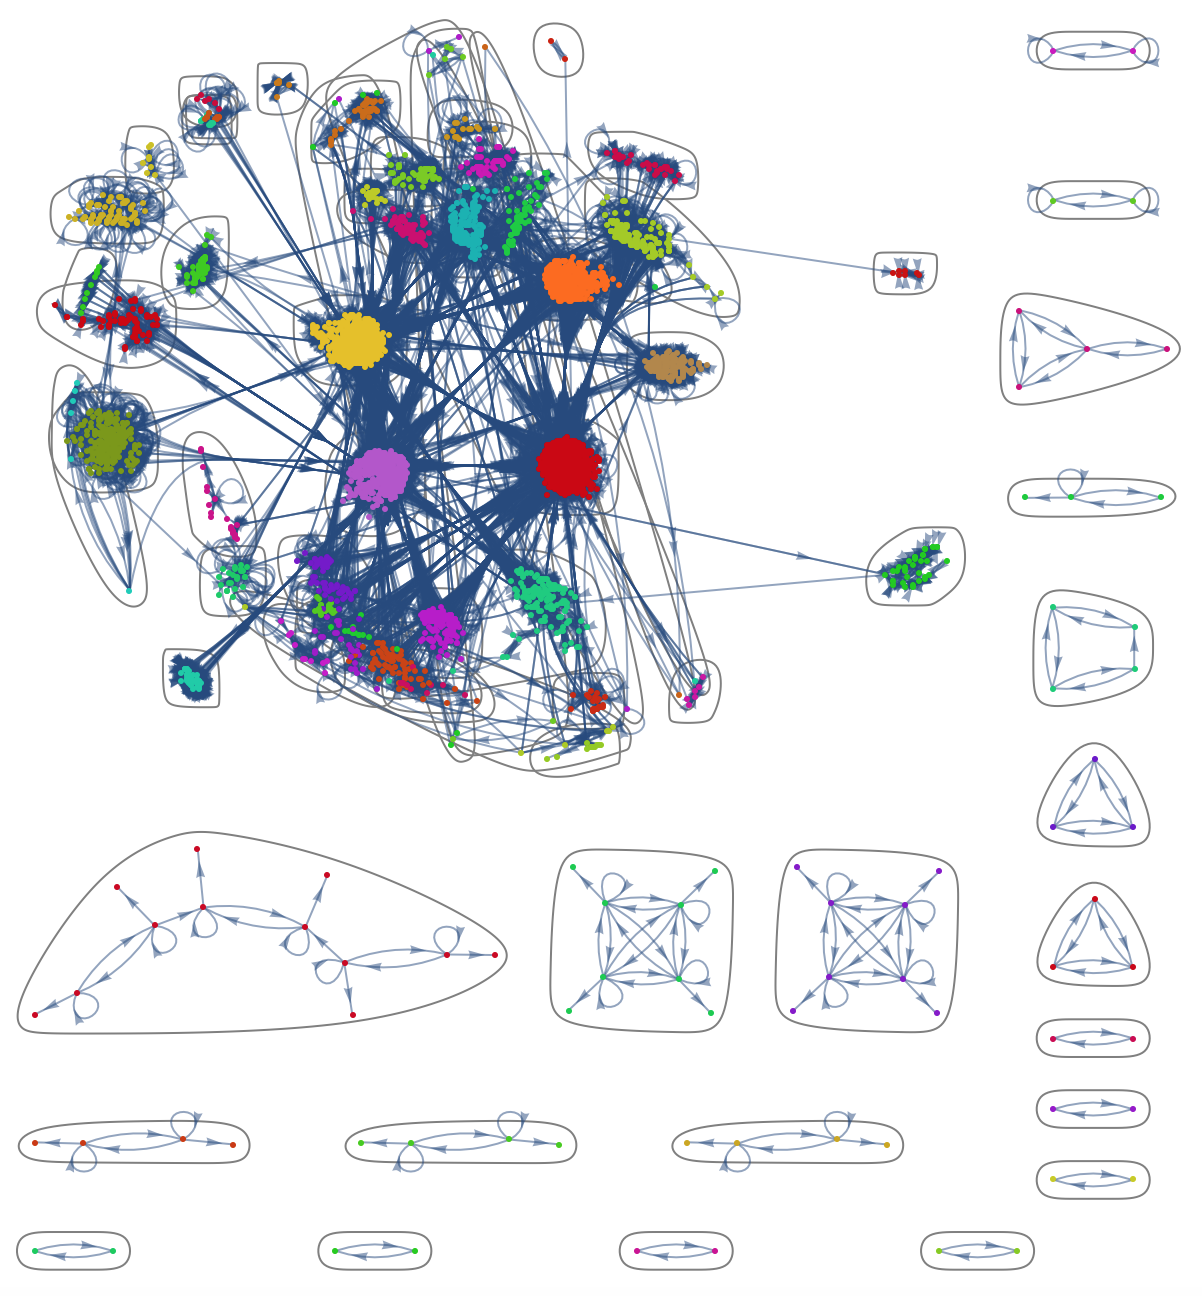
CommunityGraphPlot[g, communities]
We can now also try to gauge the importance of different functions, here the 20 most important ones, for example using the BetweenessCentrality:
Grid[Reverse[SortBy[Transpose[{vertices, BetweennessCentrality[g]}], #[[2]] &]][[1 ;; 20]], Frame -> All]
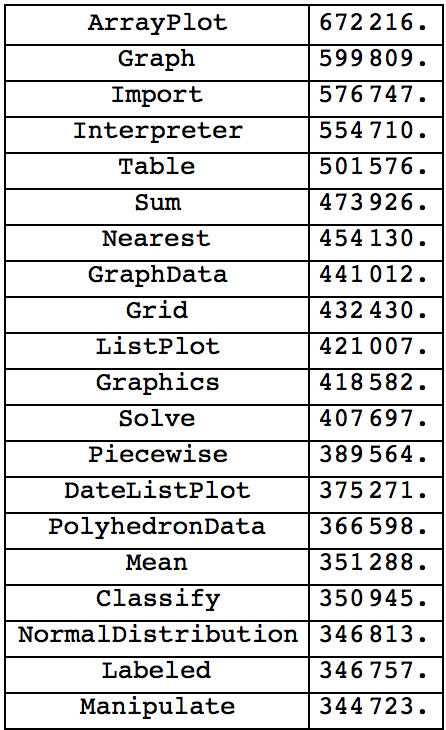
We can compare that to the VertexDegree:
Grid[Reverse[SortBy[Transpose[{vertices, VertexDegree[g]}], #[[2]] &]][[1 ;; 20]], Frame -> All]
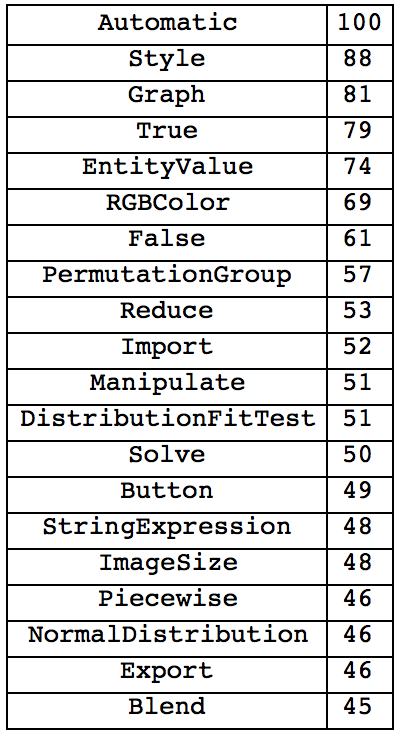
or else the PageRankCentrality:
Grid[Reverse[SortBy[Transpose[{vertices, PageRankCentrality[g, 0.85]}], #[[2]] &]][[1 ;; 20]], Frame -> All]
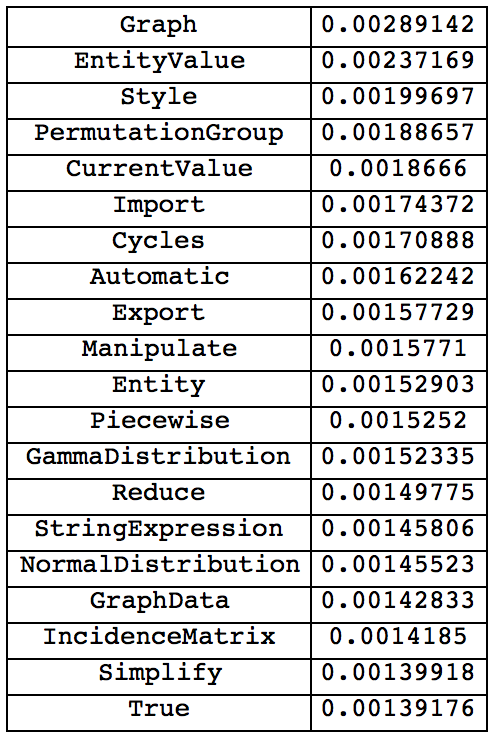
We see that in each of the cases "Graph" ranks very high. Of course we can now also look for specific functions like so:
Part[PageRankCentrality[g, 0.85], VertexIndex[g, "http://reference.wolfram.com/language/ref/" <> # <> ".html"]] & /@ {"ColorSeparate"}
(*{0.000265413}*)
Just replace the "ColorSeparate" by your favourite function. Another thing that I found interesting was the word cloud of all functions. I basically collect all instances of a function being an in- or out-vertex and applying the WordCloud function:
WordCloud[StringSplit[StringSplit[#, "/ref/"][[2]], ".html"][[1]] & /@ Flatten[{links[[All, 1]], links[[All, 2]]}]]
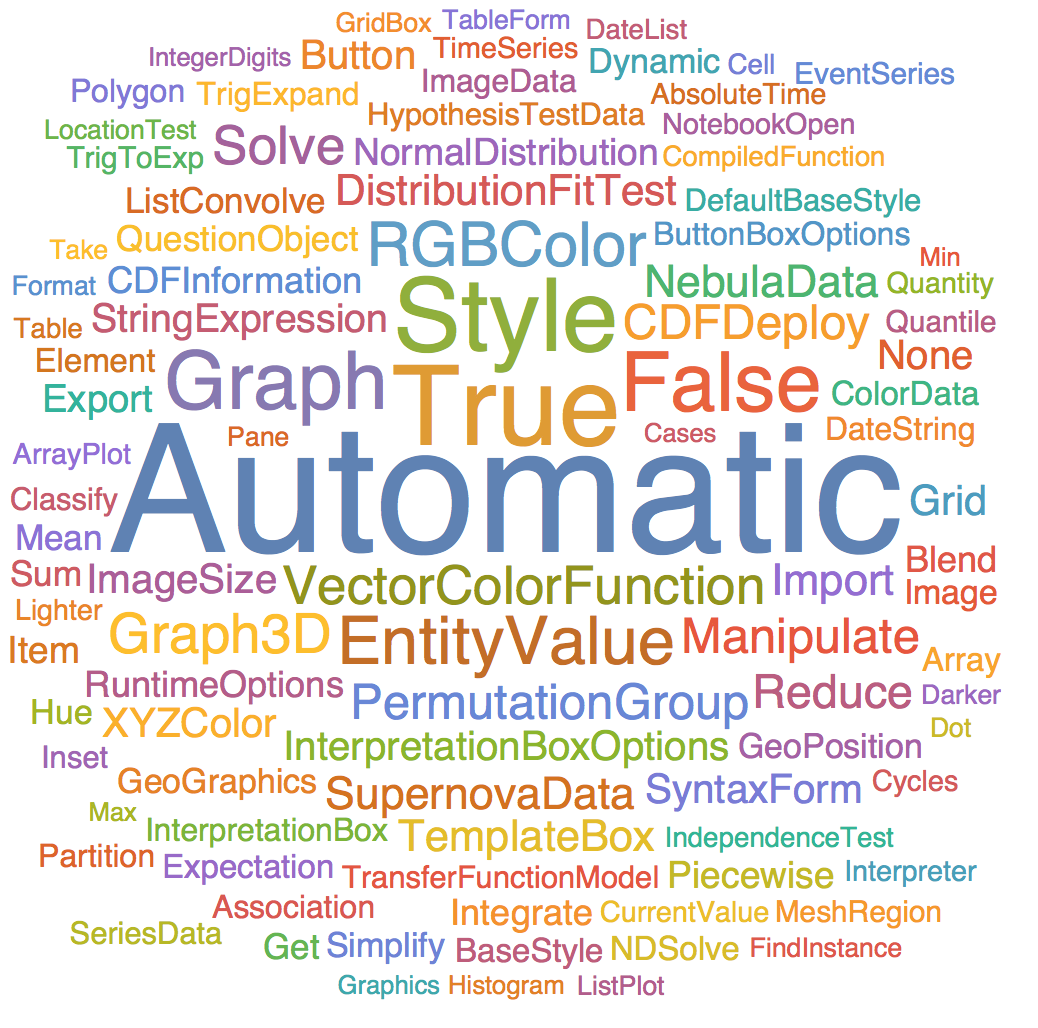
It was interesting for me that "Automatic" was so prominent. This becomes clear if we look at the VertexInDegree.
VertexInDegree[g, "http://reference.wolfram.com/language/ref/Automatic.html"]
(*93*)
as opposed to
VertexInDegree[g, "http://reference.wolfram.com/language/ref/Graph.html"]
(*76*)
and
VertexInDegree[g, "http://reference.wolfram.com/language/ref/Plot3D.html"]
(*14*)
I am quite aware that this post does not address the initial question, but I hope it is of some interest anyway.
Cheers,
M.
PS: Of course, you can now study everything hierarchically. For example we can take the largest Community:
g2 = Graph[Select[links, MemberQ[communities[[1]], #[[2]]] &]];
determine its Communities:
communities2 = FindGraphCommunities[g2];
and plot:
CommunityGraphPlot[g2, communities2]
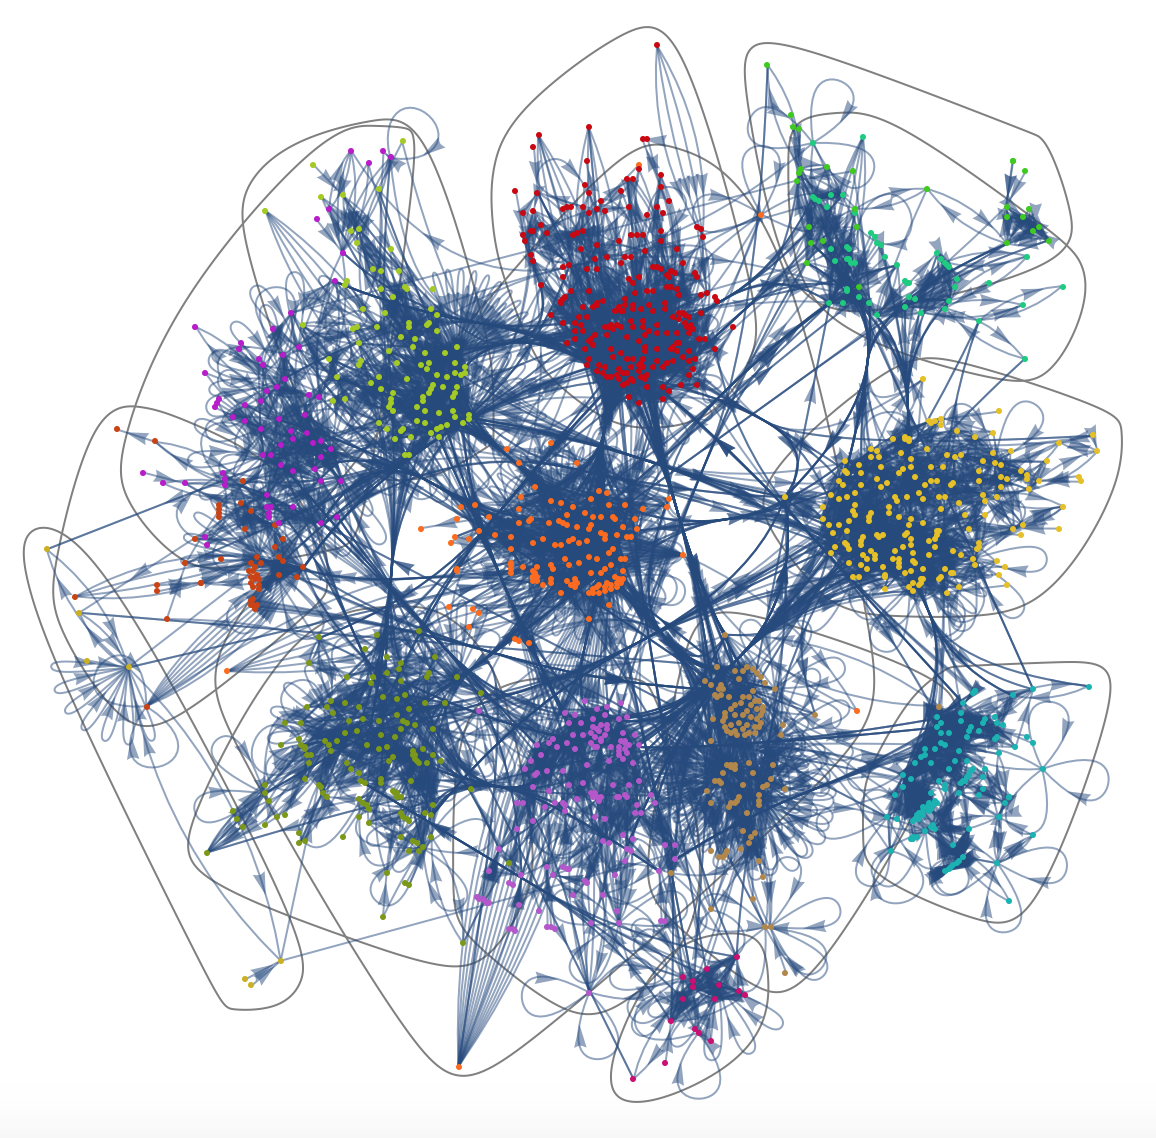
Here are members of the respective sub-Communities:
StringSplit[StringSplit[communities2[[1]], "/ref/"][[All, 2]], ".html"][[All, 1]]
{"ClickPane", "AngularGauge", "ClockGauge", "VerticalGauge",
"Slider", "VerticalSlider", "ProgressIndicator", "Locator",
"Slider2D", "ColorSlider", "Control", "LocatorPane",
"ControlsRendering", "Animate", "ListAnimate", "Manipulate",
"Animator", "Dynamic", "AutorunSequencing", "ActionMenu",
"ButtonBar", "PopupMenu", "DockedCells", "Bookmarks",
"AnimationDirection", "Arrow", "Inset", "Arrowheads",
"AnimationRunning", "Trigger", "Pause", "Manipulator",
"BaselinePosition", "Antialiasing", "Rasterize", "AnySubset",
"FormFunction", "FormObject", "CheckboxBar", "TogglerBar",
"ListPicker", "AppearanceRules", "FormLayoutFunction", "Full",
"AutoSpacing", "TextJustification", "Alignment", "TextAlignment",
"AlignmentPoint", "Item", "ControlPlacement", "Axes", "AxesLabel",
"Frame", "PlotLabel", "FrameLabel", "Background", "ImageMargins",
"Pane", "Backward", "Bottom", "MenuView", "BarSpacing", "Spacings",
"CellBaseline", "Blend", "BulletGauge", "Setter", "RadioButton",
"Panel", "SetterBar", "TabView", "ContentPadding", "FrameMargins",
"ImageSize", "GestureHandler", "EventHandler", "Refresh",
"MousePosition", "Labeled", "ControlType", "CellMargins",
"CellBracketOptions", "CellDingbat", "CellFrame",
"CellDynamicExpression", "CellEventActions", "NotebookEventActions",
"FrontEndEventActions", "CellFrameLabels", "CellFrameMargins",
"CellFrameColor", "CellFrameLabelMargins", "CellLabelMargins",
"OpenerView", "ColorSetter", "ColumnAlignments", "ItemSize",
"ChartLabels", "Checkbox", "Toggler", "Opener", "RadioButtonBar",
"ConstantImage", "FieldSize", "ContentSize", "Update", "Darker",
"DataRange", "Dividers", "Delimiter", "FinishDynamic", "Setting",
"DynamicWrapper", "FormTheme", "Forward", "ForwardBackward",
"Framed", "FrameTicks", "FrameBox", "FrameBoxOptions", "BoxFrame",
"FlipView", "SlideView", "PaneSelector", "ImageSizeAction",
"GeoMarker", "GaugeFaceElementFunction", "GaugeFaceStyle",
"GaugeFrameElementFunction", "GaugeMarkers", "HorizontalGauge",
"GaugeFrameStyle", "GaugeStyle", "ScaleRangeStyle", "GrayLevel",
"TouchPosition", "GridLines", "GeoBackground", "ThermometerGauge",
"IntervalSlider", "Hue", "IconData", "ImageAspectRatio", "ImageCrop",
"ImageDimensions", "InitializationCell", "ImageFormattingWidth",
"$ImageFormattingWidth", "ImageResolution", "PageWidth",
"format/JPEG", "format/GIF", "ImagePadding", "Text", "Magnify",
"ImageResize", "RasterSize", "Magnification", "ImageScaled",
"ImageSizeMultipliers", "PixelConstrained", "ItemStyle",
"Scrollbars", "ItemAspectRatio", "LabelingFunction", "ListPickerBox",
"ScrollPosition", "Large", "Lighter", "LocatorAutoCreate",
"LocatorRegion", "Left", "LineIndent", "LineIndentMaxFraction",
"Legended", "LegendFunction", "LegendMargins", "TouchscreenAutoZoom",
"MinIntervalSize", "Medium", "NotebookDynamicExpression",
"Overscript", "OverscriptBox", "PackingMethod", "Placed",
"PreserveImageOptions", "PlotMarkers", "PlotRangeClipping",
"PlotRangePadding", "PlotRegion", "Point", "PassEventsDown",
"PassEventsUp", "PolarAxes", "PolarTicks", "RGBColor", "Right",
"Raster", "RotateLabel", "RotationAction", "RoundingRadius",
"RowAlignments", "Rectangle", "Scale", "Small", "ScaleRanges",
"ScalingMatrix", "ScriptBaselineShifts", "ScriptSizeMultipliers",
"Set", "SetDelayed", "SynchronousInitialization",
"SynchronousUpdating", "TouchscreenControlPlacement", "Ticks",
"TrackedSymbols", "TrackingFunction", "Tiny", "Top", "Underscript",
"UpdateInterval", "WordCloud", "WordOrientation", "XYZColor"}
Using DeleteDuplicates on the links cleans up the graph considerably:
 Attachments: