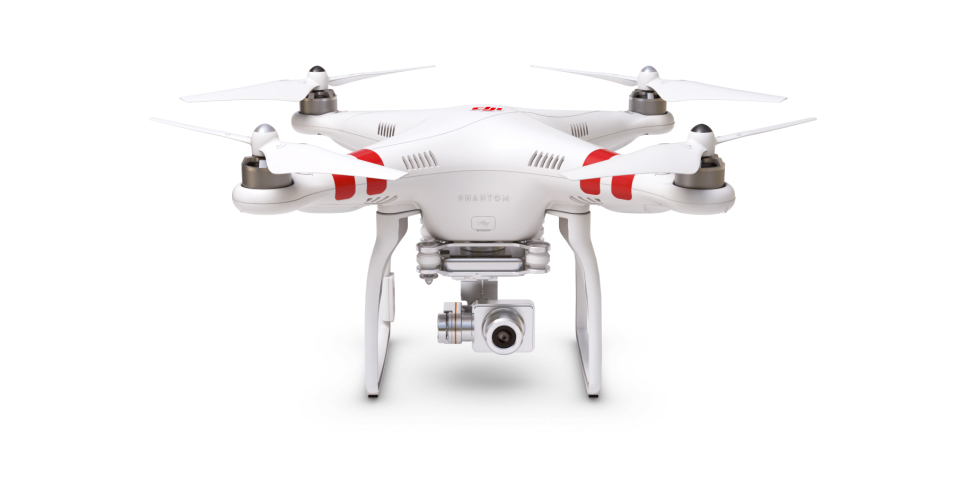
Over the summer, I had the opportunity to work with a Phantom 2 Vision+ drone from DJI. After a few exciting trial flights, I decided to investigate a real world application: fly over one of the abundant Illinois farm fields and record bird's eye images of the crops below. Then using this data, create a simple function to estimate the crop yield for that area.
Recently, I drove out to a farm with a fellow Wolfram employee who also happens to be an expert drone operator. We flew the drone over a stretch of soy fields and took pictures and shot video along the way. Here is a small sample video:
Drone flying over soy field (full video): https://vimeo.com/136947441
As you can see in the video, most areas of this field is in really good shape (at least when judged from this altitude). But there are some areas near a drainage ditch where the soy is not growing very well. This can happen because the soil is too moist for too long causing the root system to lack oxygen. As a result the soy plants are much smaller near the drainage area or completely missing.
Let's look at one particular example of this situation. We import the data from the SD card that was used as storage on the drone:
crop = Import["F:\\DCIM\\101MEDIA\\DJI01951.JPG"]
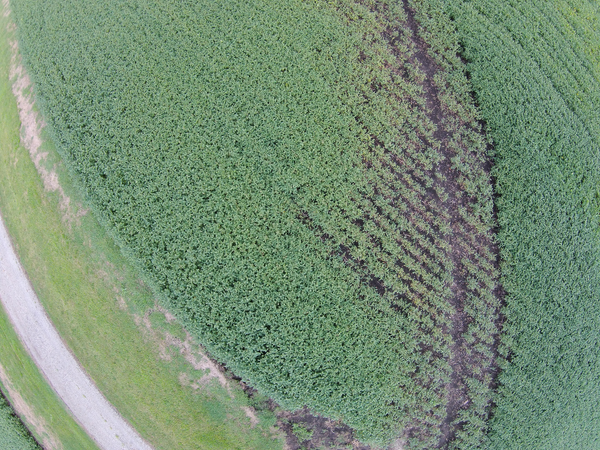
The first thing to notice is the large amount of barrel distortion in this image (note how the road looks highly curved). This is due to the drone camera having very wide angle lens. There is no built-in function in the Wolfram Language to simply correct for barrel distortion (yet), so I am going to focus on a center part of the image where the distortion is not too bad. The ideal situation here would be to fly very high with a very narrow lens.
So first, to get a smaller center part of the image, let's take a look at a subimage about 1/3 x 1/3 the size of the original, located a little bit right of the center:
{columns, rows} = ImageDimensions[crop];
{rowLow, rowHigh} = {Round[rows/3], Round[2 rows/3]};
{columnLow, columnHigh} = {Round[columns/2], Round[5 columns/6]};
HighlightImage[crop, Rectangle[{columnLow, rowLow}, {columnHigh, rowHigh}], Method -> "Brightness"]
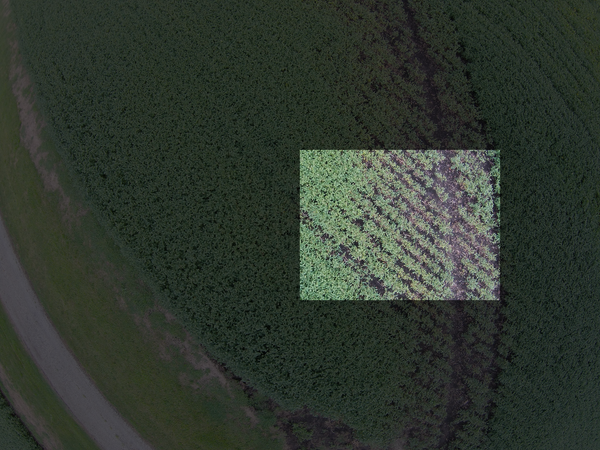
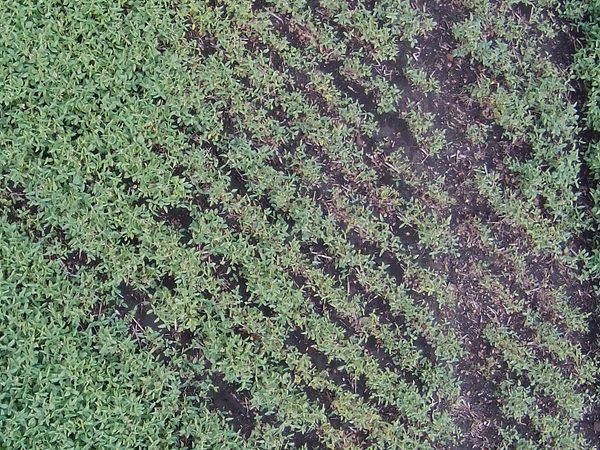
Using this region we can now get a sample of the crop that contains both very healthy plants (on the left) and very small or missing plants (on the right):
cropSample = ImageTake[crop, {rowLow, rowHigh}, {columnLow, columnHigh}]
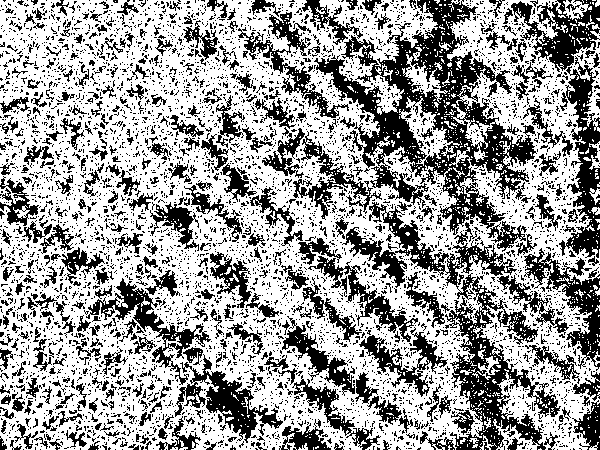
So now the question becomes: how do I measure what fraction of the harvest is lost in this sample? A simple approach is to just turn the image into a black and white image where a white color indicates a bright area (like the green plants) and a black color indicates the soil (dark in the original image):
binaryCrop1 = Binarize[cropSample]
That sort of works, but the original sample still had bright areas due to visible rocks and dead leaves, so let's see if we can refine this approach just a little bit. Instead of using just a plain binarize we can look at the dominant color in this image, which we expect to be greens and blacks:
dominantColors = DominantColors[cropSample, 10]

The result here is more or less as we would expect, with some additional grays (perhaps from dead leaves and rocks).
Now let's take a look at the first dominant color, a good fit for a healthy soy plant in this image. Using this color we can now calculate the color distance for each pixel giving us an image where dark colors are close matches and white colors are poor matches:
ColorDistance[cropSample, First[dominantColors]]

Again we can binarize this image. In this case also need to negate the black/white colors to get white/black so the colors in the binarized image have the same meaning as before (white=soy, black=not soy):
binaryCrop2 = ColorDistance[cropSample, First[dominantColors]] // Binarize // ColorNegate
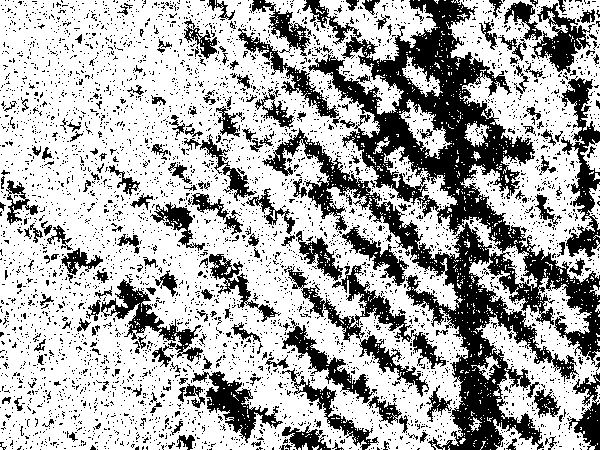
This result actually looks quite nice: Areas with no soy plants now have a black pixel values (0) and areas with soy plants have white pixel values (1). So let's count the white pixels:
soyPixels = ImageMeasurements[binaryCrop2, "Total"]
(* Gives: 954,214.0 *)
And also lets count the total number of pixels in the image:
totalPixels = Times @@ ImageMeasurements[binaryCrop2, "Dimensions"]
(* Gives: 1,603,814 *)
And now we have our crude estimate for the amount of soy plants in this image, about 60%:
Quantity[100 soyPixels/totalPixels, "Percent"]
(* Gives: 59.4966% *)
Of course this is a very crude estimation, but perhaps not too far off from the actual yield when this particular spot is harvested. I actually expect this to be a slight overestimation, since smaller plants will likely have no soy beans or less soy beans than a fully grown plant. But I am not a crop analyst, so we'll have to go with 60% for now.
Finally, an analysis like this can easily be done on the fly (or "on the drone" in this case), where an embedded system like a Raspberry Pi or similar device can process data as it comes in, and even direct the drone to the areas of highest interest (with the most stressed plants).


