When reading the shocking news about the mass shooting at San Bernardino, I came across the site http://shootingtracker.com that keeps a decent track of mass shootings in US since 2013. (I recommend to download the raw data when the site opens for you. It limits no. of visits probably by IP address. And you can use the data in reports as long as you give attribution to the site).
The raw data in csv version is quite clean. It contains the date, city and even links to relevant news reports among other things.
It is a shock to learn that so far in 2015, the mass shootings have outnumbered the days. New Yorker's article laments Only in America, as the song says- only in America are there enough mass shootings in a single week to allow pundits and philosophers to make complicated points about the nature of responsibility and guilt that elsewhere might exist only in the realm of gruesome thought experiments.
I would like to have a more intuitive way to see whats going on, so I turned toward Wolfram Language for nice visualization of the mass shooting tracking data.
The raw data only need a little bit of cleanup by replacing the state postal code with the full state name in camel case, so Wolfram Language can easily find the coordinate by using CityData[]. You can find the state and state postal code data online, and programmatically solve the issue. (Caveat: some cities in the raw data are not exactly cities, and I dismissed those entries that return Missing[])
The code and result are available in the attached CDF file. Here's a screenshot:
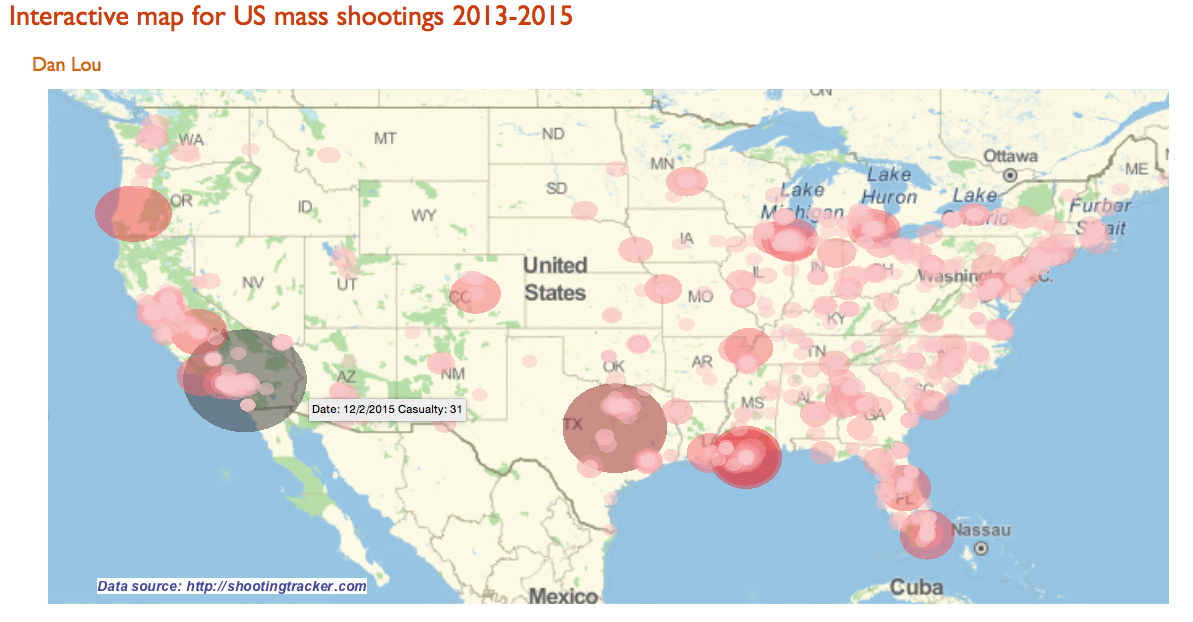
Here is how the mass shootings are presented on the map:
- Every disk stands for a mass shooting tragedy
- The radius of the disk is in proportion with the number of casualty. The color of the disk is also determined by the number of casualty
- Mouse over each disk, and the tool tip will show the date of the tragedy and the number of casualty
- Click on each disk, and it will open a link of relevant news report
The file StatePostalCode.csv (attached) was created by copying information from:
http://www.infoplease.com/ipa/A0110468.html
    states = Import["Desktop/StatePostalCode.csv"];
    statesAssoci = AssociationThread[states[[All, 2]] -> states[[All, 1]]];
    shootings2015 = Import["Desktop/2015CURRENT.csv"];
    shootings2014 = Import["Desktop/2014MASTER.csv"];
    shootings2013 = Import["Desktop/2013MASTER.csv"];
    shootings = Join[shootings2015[[2 ;;]], shootings2014[[2 ;;]], shootings2013[[2 ;;]]];
    shootingsSplitHype =
      Flatten[{#[[2]], #[[4]] + #[[5]],
          StringSplit[StringReplace[#[[6]], " " -> ""], ","], #[[7]] }] & /@ shootings;
    shootingsAssociHype =
      Flatten[{#[[1 ;; 2]], #[[5]], #[[3]], StringReplace[statesAssoci[#[[4]]], " " -> ""],
          "UnitedStates"}] & /@ shootingsSplitHype;
    shootingsEntityHype =
      DeleteCases[{#[[1 ;; 3]], CityData[Entity["City", {#[[4]], #[[5]], #[[6]]}], "Coordinates"]} & /@
        shootingsAssociHype, _?baddata];
    Monitor[disksHype =
       Table[
        Tooltip[Hyperlink[
          GeoDisk[
           shootingsEntityHype[[i, 2]], Quantity[shootingsEntityHype[[i, 1, 2]]*10, "KiloMeters"]],
          shootingsEntityHype[[i, 1, 3]]],
         StringJoin["Date: ", shootingsEntityHype[[i, 1, 1]], " Casualty: ",
          ToString[shootingsEntityHype[[i, 1, 2]]]]
         ],
        {i, Length[shootingsEntityHype]}];, i
     ]
    graphHype = GeoGraphics[{GeoStyling[], {Opacity[0.5],
          ColorData["CherryTones", 1 - #[[1, 1, 2, 1]]/310], #} & /@
        SortBy[disksHype, -#[[1, 1, 2]] &],
       Text[Style[Hyperlink["Data source: http://shootingtracker.com", "http://shootingtracker.com"],
         14, Bold, Italic], {-118, 23}]}, GeoRange -> {{22., 50.}, {-128, -65}}]


