Message Boards Message Boards

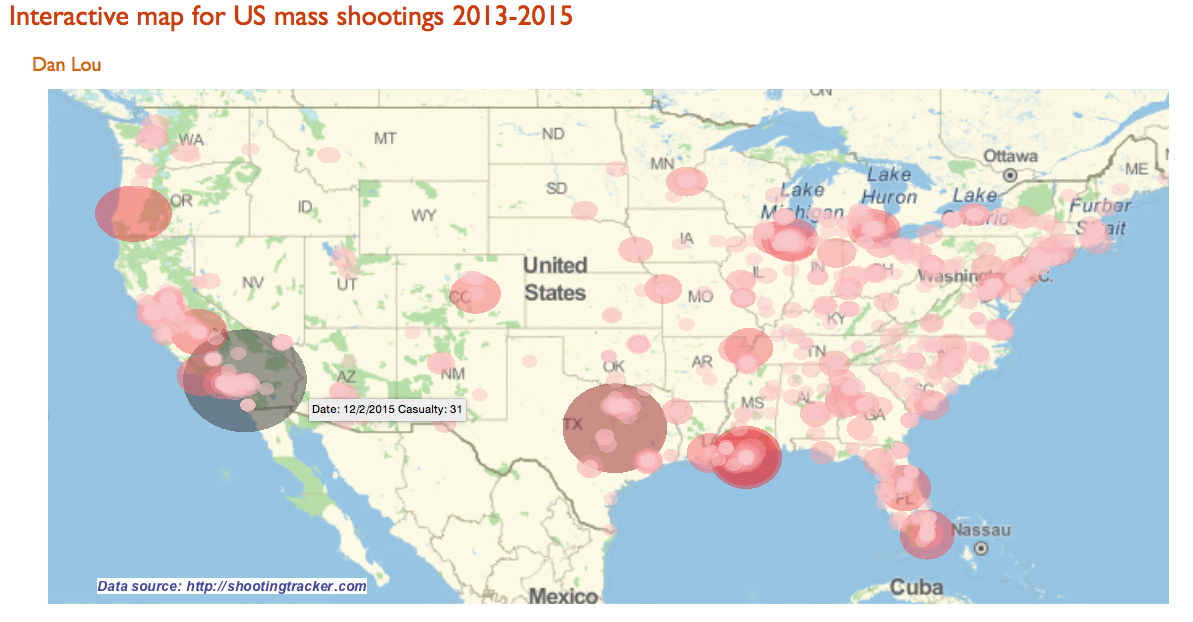
Interactive map for US mass shootings 2013-2015

Posted 9 years ago

When reading the shocking news about the mass shooting at San Bernardino, I came across the site http://shootingtracker.com that keeps a decent track of mass shootings in US since 2013. (I recommend to download the raw data when the site opens for you. It limits no. of visits probably by IP address. And you can use the data in reports as long as you give attribution to the site).

The raw data in csv version is quite clean. It contains the date, city and even links to relevant news reports among other things.

It is a shock to learn that so far in 2015, the mass shootings have outnumbered the days. New Yorker’s article laments “Only in America, as the song says- only in America are there enough mass shootings in a single week to allow pundits and philosophers to make complicated points about the nature of responsibility and guilt that elsewhere might exist only in the realm of gruesome thought experiments”.

I would like to have a more intuitive way to see what’s going on, so I turned toward Wolfram Language for nice visualization of the mass shooting tracking data.

The raw data only need a little bit of cleanup by replacing the state postal code with the full state name in camel case, so Wolfram Language can easily find the coordinate by using CityData[]. You can find the state and state postal code data online, and programmatically solve the issue. (Caveat: some cities in the raw data are not exactly cities, and I dismissed those entries that return Missing[])

The code and result are available in the attached CDF file. Here’s a screenshot: shootings

Here is how the mass shootings are presented on the map:

  1. Every disk stands for a mass shooting tragedy
  2. The radius of the disk is in proportion with the number of casualty. The color of the disk is also determined by the number of casualty
  3. Mouse over each disk, and the tool tip will show the date of the tragedy and the number of casualty
  4. Click on each disk, and it will open a link of relevant news report

The file StatePostalCode.csv (attached) was created by copying information from:

http://www.infoplease.com/ipa/A0110468.html

    states = Import["Desktop/StatePostalCode.csv"];
    statesAssoci = AssociationThread[states[[All, 2]] -> states[[All, 1]]];
    shootings2015 = Import["Desktop/2015CURRENT.csv"];
    shootings2014 = Import["Desktop/2014MASTER.csv"];
    shootings2013 = Import["Desktop/2013MASTER.csv"];
    shootings = Join[shootings2015[[2 ;;]], shootings2014[[2 ;;]], shootings2013[[2 ;;]]];
    shootingsSplitHype = 
      Flatten[{#[[2]], #[[4]] + #[[5]], 
          StringSplit[StringReplace[#[[6]], " " -> ""], ","], #[[7]] }] & /@ shootings;
    shootingsAssociHype = 
      Flatten[{#[[1 ;; 2]], #[[5]], #[[3]], StringReplace[statesAssoci[#[[4]]], " " -> ""], 
          "UnitedStates"}] & /@ shootingsSplitHype;
    shootingsEntityHype = 
      DeleteCases[{#[[1 ;; 3]], CityData[Entity["City", {#[[4]], #[[5]], #[[6]]}], "Coordinates"]} & /@ 
        shootingsAssociHype, _?baddata];
    Monitor[disksHype =
       Table[
        Tooltip[Hyperlink[
          GeoDisk[
           shootingsEntityHype[[i, 2]], Quantity[shootingsEntityHype[[i, 1, 2]]*10, "KiloMeters"]], 
          shootingsEntityHype[[i, 1, 3]]],
         StringJoin["Date: ", shootingsEntityHype[[i, 1, 1]], " Casualty: ", 
          ToString[shootingsEntityHype[[i, 1, 2]]]]
         ],
        {i, Length[shootingsEntityHype]}];, i
     ]
    graphHype = GeoGraphics[{GeoStyling[], {Opacity[0.5], 
          ColorData["CherryTones", 1 - #[[1, 1, 2, 1]]/310], #} & /@ 
        SortBy[disksHype, -#[[1, 1, 2]] &], 
       Text[Style[Hyperlink["Data source: http://shootingtracker.com", "http://shootingtracker.com"], 
         14, Bold, Italic], {-118, 23}]}, GeoRange -> {{22., 50.}, {-128, -65}}]
Attachments:
POSTED BY: Dan Lou
10 Replies

This is sad but very interesting post, thank you for sharing! I am trying to run the code in you CDF file. But I use direct import for shooting files:

shootings2013 = Import["http://shootingtracker.com/tracker/2013MASTER.csv"];
shootings2014 = Import["http://shootingtracker.com/tracker/2014MASTER.csv"];
shootings2015 = Import["http://shootingtracker.com/tracker/2015CURRENT.csv"];

And I get error in this line:

shootingsAssociHype = 
  Flatten[{#[[1 ;; 2]], #[[5]], #[[3]], StringReplace[statesAssoci[#[[4]]], " " -> ""], 
      "UnitedStates"}] & /@ shootingsSplitHype;

String or list of strings expected at position 1 in StringReplace

Do you know why by any chance ?

POSTED BY: Marina Shchitova

Dan, I've just updated that old post, thanks!

Here are some pieces of code to visualize the larger trend suggested by @Jonathan Wallace:

  • Crime in the United States by Volume and Rate per 100,000 Inhabitants, 1992-2011:

    crime=Import["https://www.fbi.gov/about-us/cjis/ucr/crime-in-the-u.s/2011/crime-in-the-u.s.-2011/tables/table-1/output.xls","Data"][[1,4;;-36,1;;-5]];
    i=1992;interpreters[{year_,population_,violentCrime_,violentCrimeRate_,murder_,murderRate_,rape_,rapeRate_,robbery_,robberyRate_,aggravatedAssault_,aggravatedAssaultRate_,propertyCrime_,propertyCrimeRate_,burglary_,burglaryRate_,larceny_,larcenyRate_,motorVehicle_,motorVehicleRate_}]:=<|
    "year"->DateObject[{i++}],
    "population"->Interpreter["Integer"][population],"crime"->Interpreter["Integer"][violentCrime],
    "murder"->Interpreter["Integer"][murder],
    "rape"->Interpreter["Integer"][rape],
    "robbery"->Interpreter["Integer"][robbery],
    "assault"->Interpreter["Integer"][aggravatedAssault],
    "property"->Interpreter["Integer"][propertyCrime],
    "burglary"->Interpreter["Integer"][burglary],
    "larcency"->Interpreter["Integer"][larceny],
    "motor"->Interpreter["Integer"][motorVehicle],"crime rate"->Interpreter["Number"][violentCrimeRate],"murder rate"->Interpreter["Number"][murderRate],"rape rate"->Interpreter["Number"][rapeRate],"robbery rate"->Interpreter["Number"][robberyRate],"assault rate"->Interpreter["Number"][aggravatedAssaultRate],"property rate"->Interpreter["Number"][propertyCrimeRate],"burglary rate"->Interpreter["Number"][burglaryRate],"larcency rate"->Interpreter["Number"][larcenyRate],"motor rate"->Interpreter["Number"][motorVehicleRate]|>;
    crimeUS=Dataset[interpreters/@Drop[crime,1]]
    

US Crime Volume and Rates

crimeUS[DateListPlot, {"year", "murder"}]

murders

DateListPlot of Crime by Volume:

DateListPlot[Transpose@Normal@Values@crimeUS[All, 3 ;; 11], {1992}, 
 PlotTheme -> "Detailed", 
 PlotLegends -> Normal@Keys[crimeUS[1, 3 ;; 11]]]

Crime by Volume

DateListLogPlot of Crime by Rate per 100,000 Inhabitants:

DateListLogPlot[
 Transpose@Normal@Values@crimeUS[All, 12 ;; 20], {1992}, 
 PlotTheme -> "Detailed", 
 PlotLegends -> Normal@Keys[crimeUS[1, 12 ;; 20]]]

US Crime Rate

  • Homicides by Firearm compared to other countries (2007 only):

    homicides = Import["homicides.m"]
    

Homicides

Percentage of homicides by firearm:

    GeoRegionValuePlot[homicides[All, #country -> #percentage &]]

percentage of homicides by firearm

Number of homicides by firearm:

GeoRegionValuePlot[homicides[All, #country -> #number &]]

number homicides

Homicide by firearm rate per 100,000 population:

GeoRegionValuePlot[homicides[All, #country -> #rate &]]

rate homicides

  • Murder Victims by Weapon, 2008-2012

    murderVictims=Dataset[<|#[[1]]-><|"2008"->IntegerPart@#[[2]],
    "2009"->IntegerPart@#[[3]],
    "2010"->IntegerPart@#[[4]],
    "2011"->IntegerPart@#[[5]],
    "2012"->IntegerPart@#[[6]]|>&/@Import["https://www.fbi.gov/about-us/cjis/ucr/crime-in-the-u.s/2012/crime-in-the-u.s.-2012/offenses-known-to-law-enforcement/expanded-homicide/expanded_homicide_data_table_8_murder_victims_by_weapon_2008-2012.xls/output.xls"][[1,5;;-5,1;;-4]]|>]
    

Murder Victims

PieCharts:

Column[PieChart[murderVictims[Join[Range[3,10],{-1}],#],
ChartLegends->Normal@Keys[murderVictims[Join[Range[3,10],{-1}],#]],
ChartElementFunction->ChartElementDataFunction["GlassSector","GradientDirection"->"Angular"],
LabelingFunction->"RadialOutside",
ChartStyle->10,
PlotLabel->#]&/@{"2008","2009","2010","2011","2012"}]

Murder Victims PieCharts

Attachments:
POSTED BY: Bernat Espigulé
Posted 9 years ago

Hi Marina,

Good catch!

I am seeing the same error when running my code, and I think it is because occasionally, when I split the State postal code in the original shootings csv filesusing ",", it failed to find a valid split for the state postal code.

So when in the next step, I try to replace the state postal code with full name of the state, it fails with warning.

For example, if you try this out:

shootingsSplit[[All, 4]]

You will get a warning:

Part::partw: Part 4 of {8/8/2014,4,WashingtonDC} does not exist. >>

And it is because in the original shootings file, it has a line like this:

8/8/14  Unknown  0    4  Washington DC    http://www.washingtonpost.com/local/quadruple-shooting-in-northeast/2014/08/09/4f87a8fa-1fda-11e4-82f9-2cd6fa8da5c4_story.html     
POSTED BY: Dan Lou

Very sad discussion...

We tend to magnify primacy, but what does a larger data set reveal?

I would be very curious to see the different ways the Wolfram Language can visualize the larger trend.

POSTED BY: Jonathan Wallace

Good effort to express the morbid truth, @Dan Lou. Quick tips... Postal codes are built in in Wolfram Language, you do not have to import them. Here is how. Get all USA states:

divisions = Entity["Country", "UnitedStates"][EntityProperty["Country", "AdministrativeDivisions", {}]]

enter image description here

Then get the rules as:

Rule @@@ AdministrativeDivisionData[divisions, {"StateAbbreviation", "Entity"}]

enter image description here

Also SemanticImport does good job on 2013 and 2014 but breaks on 2015 data - I think they messed up their data file.

SemanticImport["http://shootingtracker.com/tracker/2014MASTER.csv"]

enter image description here

POSTED BY: Vitaliy Kaurov
Posted 9 years ago

@Bernat Espigulé Pons Wow, this is very cool. Thank you so much for showing me how to use SemanticImport and Datasets together. I will definitely use these handy tools in data analysis.

BTW, Your post Mapping Crime Rates in US might have also answered part of @Jonathan Wallace 's inquiry.

POSTED BY: Dan Lou
Posted 9 years ago

@Marina, I've updated my CDF file in the original post.

It seems the line:

shootingsAssociHype = 
  Flatten[{#[[1 ;; 2]], #[[5]], #[[3]], 
      StringReplace[statesAssoci[#[[4]]], 
       " " -> ""], "UnitedStates"}] & /@ shootingsSplitHype;

Should be replaced by:

shootingsAssociHype = 
  Flatten[{#[[1 ;; 2]], #[[5]], #[[3]], 
      StringReplace[statesAssoci[StringTrim[ToUpperCase[#[[4]]]]], 
       " " -> ""], "UnitedStates"}] & /@ shootingsSplitHype;

Because in the shootings file, the state postal code is not always in uppercase, and sometimes it contains space that can only be deleted by StringTrim.

The new CDF file will also show how many entries are deleted because it cannot find a coordinate for a certain location.

@Vitaliy, Thank you for sharing with me the Postal code already available in WL. I think this can further simply my code to be:

divisions = Entity["Country", "UnitedStates"][EntityProperty["Country", "AdministrativeDivisions", {}]];
adms=AdministrativeDivisionData[divisions, {"StateAbbreviation", "Entity"}];
statesAssoci=AssociationThread[adms[[All,1]],adms[[All,2]]];
shootingsSplitHype =Flatten[{#[[2]], #[[4]] + #[[5]], {StringSplit[StringReplace[#[[6]], " " -> ""], ","]}, #[[7]] },1] & /@ shootings;
shootingsAssociHype =Flatten[{
#[[1 ;; 2]], 
#[[4]], 
{If[
Length[#[[3]]]==2,
CityData[Entity[
"City" ,  {#[[3,1]], statesAssoci[ToUpperCase[StringTrim[#[[3,2]]]]][[2, 1]],
statesAssoci[ToUpperCase[StringTrim[#[[3,2]]]]][[2, 2]]}], "Coordinates"],
Missing["NotAvailable"]
]
}},1] &/@ shootingsSplitHype;

For some reason, Entity[] only works for me in Wolfram Cloud, so I have not tested out the complete code yet.

POSTED BY: Dan Lou

@Dan Lou this is an interesting interactive map. About a year ago I did something similar, see Mapping Crime Rates in the US. I find SemanticImport and the ability to work with Datasets really useful. Here is how I managed to build a clean dataset out of their 2015 data file.

  • First, I take a look at the header line of:

    First[Import["http://shootingtracker.com/tracker/2015CURRENT.csv"]]
    

{"", "Date", "Shooter", "Dead", "Injured", "Location", "Article", "Article", "Article", "Article", "Article"}

  • Then I specify the column types that need to be interpreted with SemanticImport:

    columnTypes=<|2->"Date",3->"String",4->"Integer",5->"Integer",6->Restricted["City"]|>;
    data=SemanticImport["http://shootingtracker.com/tracker/2015CURRENT.csv",columnTypes,"NamedRows"]
    
  • And finally, I build a dataset with the default column names changed:

    dataset15=Dataset[data][All,<|"Date"->"column1","Shooter"->"column2","Killed"->"column3","Wounded"->"column4","Location"->"column5"|>]
    

dataset 2015

I find working with datasets really convenient to perform all sorts of direct analysis like:

Reverse[Sort[dataset15[Counts, "Location"]]]

frequencies

POSTED BY: Bernat Espigulé

enter image description here - you earned "Featured Contributor" badge, congratulations !

This is a great post and it has been selected for the curated Staff Picks group. Your profile is now distinguished by a "Featured Contributor" badge and displayed on the "Featured Contributor" board.

POSTED BY: EDITORIAL BOARD

Great interactive map about mass shootings @Dan Lou ! I created a similar map for 2016 using a dataset from the http://www.gunviolencearchive.org/

Here you can check my post: http://community.wolfram.com/groups/-/m/t/866470

enter image description here

Reply to this discussion
Community posts can be styled and formatted using the Markdown syntax.
Reply Preview
Attachments
Remove
or Discard

Group Abstract Group Abstract