Dear @Vitaliy Kaurov ,
I haven't had much time to do this but here are a couple of thoughts. It is certainly interesting to use the Wolfram Language to analyse Shakespeare's texts. He is very much on everyone's mind; here are the English language wikipedia requests:
data = WolframAlpha[ "Shakespeare", {{"PopularityPod:WikipediaStatsData", 1}, "ComputableData"}];
DateListPlot[data, PlotRange -> All, PlotTheme -> "Detailed",
 AspectRatio -> 1/4, ImageSize -> 800, PlotLegends -> {"Shakespeare"},Filling -> Bottom]

There is a clear peak every year on 23 April - the anniversary of his death. Of course, there are wikipedia articles in many other languages on Shakespeare:
WikipediaData["Shakespeare", "LanguagesList"]

Interestingly, we can see the the longest articles are not (!) in English:
wikilength =
  Select[{#,
      Quiet[WordCount[
        WikipediaData[Entity["Person", "WilliamShakespeare::s9r82"],
         "ArticlePlaintext", "Language" -> #]]]} & /@
    WikipediaData["Shakespeare", "LanguagesList"], NumberQ[#[[2]]] &];
BarChart[(Reverse@
    SortBy[Append[
      wikilength, {"English",
       WordCount[
        WikipediaData[Entity["Person", "WilliamShakespeare::s9r82"],
         "ArticlePlaintext"]]}], Last])[[1 ;; 60, 2]],
 ChartLabels -> (Rotate[#, Pi/2] & /@ (Reverse@
      SortBy[Append[
         wikilength, {"English",
          WordCount[
           WikipediaData[
            Entity["Person", "WilliamShakespeare::s9r82"],
            "ArticlePlaintext"]]}], Last][[All, 1]]))]
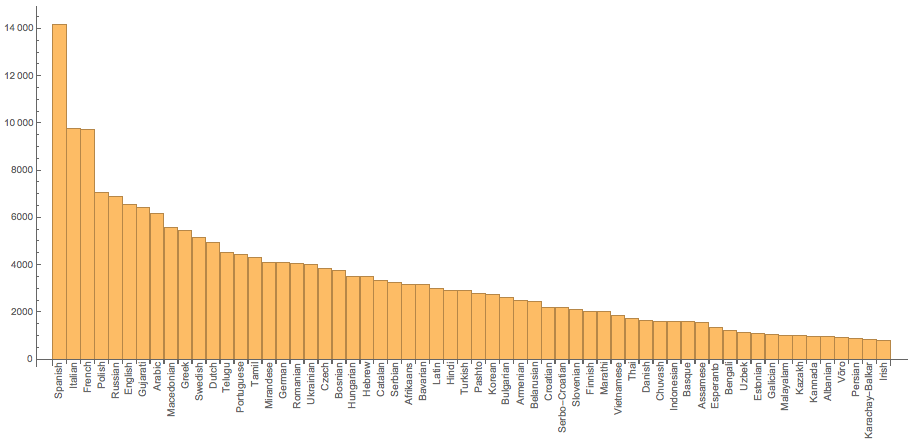
I have downloaded the csv/xls version of the collected works you linked to, and then imported the data into Mathematica in the standard way:
texts = Import["/Users/thiel/Desktop/will_play_text.csv.xls"];
There are
Length[texts]
111396 rows in that file. They look like this:
texts[[1 ;; 10]] // TableForm

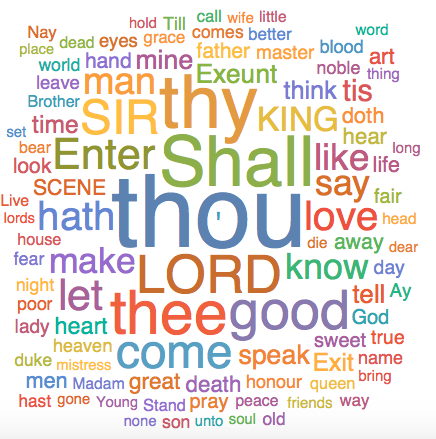
The first entry in every row just counts up then there is the name of the play, then two other bits of information on the position in the text, then there is the person who speaks and then there is what they say. There are also some spare quotation marks etc. This can be cleaned and we can look at the most important words that Shakespeare uses (here in his Sonnets):
WordCloud[
 DeleteStopwords[Flatten[TextWords /@ (StringReplace[StringSplit[#, ";"], "\"" -> ""] & /@ texts[[1 ;;, -1]])[[All, -1]]]], IgnoreCase -> True]
We can also count the words in all texts:
Length@Flatten[
  TextWords /@ (StringReplace[StringSplit[#, ";"], "\"" -> ""] & /@ texts[[1 ;;, -1]])[[All, -1]]]
which gives 775418 words. I can also sort the sentences by play like so
byplay = GroupBy[(StringReplace[StringSplit[#, ";"], "\"" -> ""] & /@ texts[[1 ;;, -1]]), #[[2]] &];
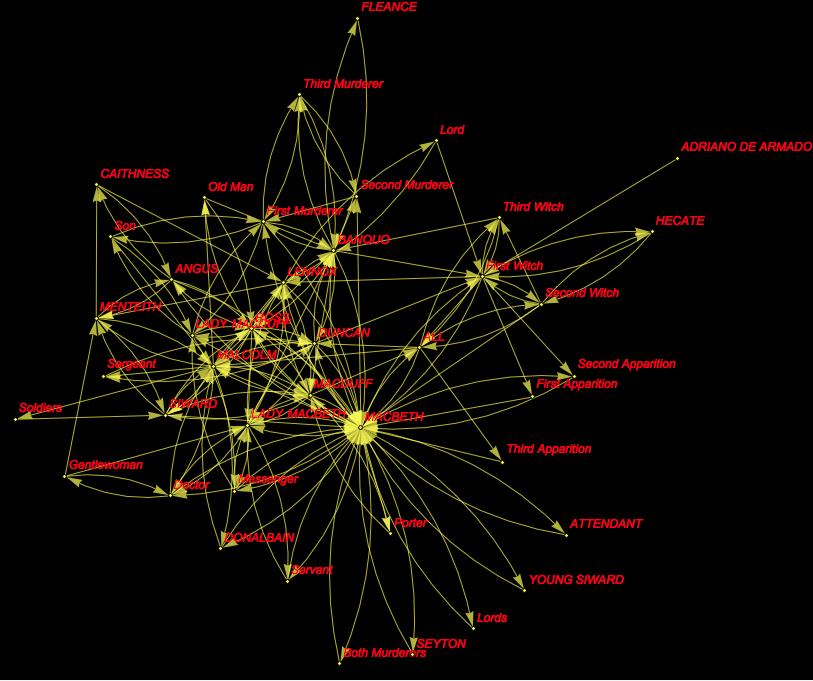
No magic here, but it is quite useful if we want to automatically generate a graph of who talks to whom, similar to one of the really cool demonstrations on the demonstration project:
g = Graph[
  DeleteDuplicates@(Rule @@@
     Partition[byplay[[18, All, 5]] //. {a___, x_, y_, b___} /; x == y -> {a, x, b}, 2, 1]), VertexLabels -> "Name",
  VertexLabelStyle -> Directive[Red, Italic, 12], Background -> Black,EdgeStyle -> Yellow, VertexSize -> Small, VertexStyle -> Yellow]
byplay[[18, All, 5]] chooses play 18 - which happens to be Macbeth. It then takes all sentences and the speaker (entry 5). The rule deletes repeated speakers, i.e. if one speaker says several lines in a row I just use one incident. The Partition function always chooses two consecutive speakers (assuming that they interact). Finally I delete the duplicates and plot it; this give the following graph:
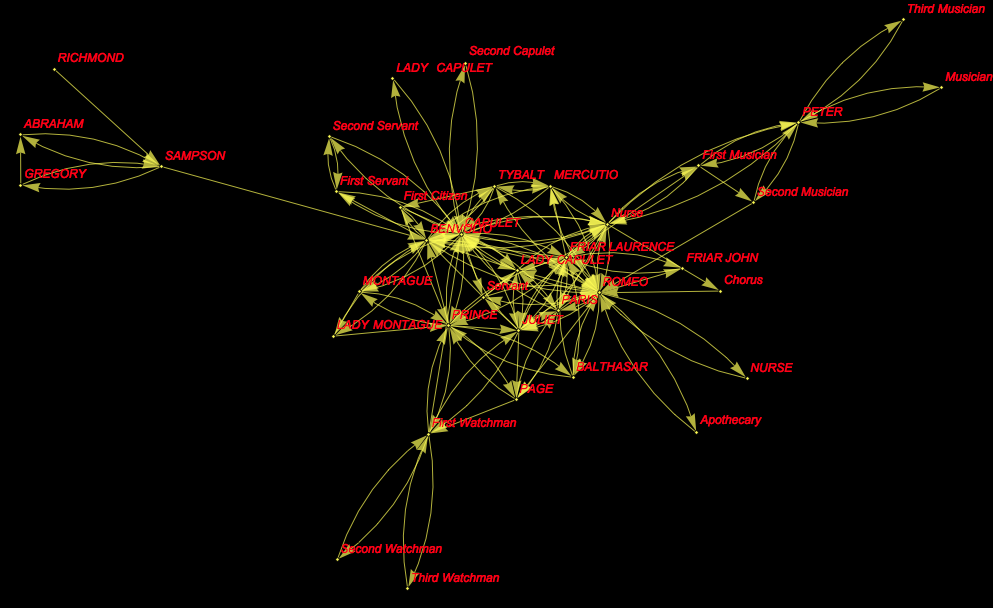
It is not trivial to make the same thing for other plays, say Romeo and Juliet (play 28):
g2 = Graph[
  DeleteDuplicates@(Rule @@@
     Partition[byplay[[28, All, 5]] //. {a___, x_, y_, b___} /; x == y -> {a, x, b}, 2, 1]), VertexLabels -> "Name",
  VertexLabelStyle -> Directive[Red, Italic, 12], Background -> Black,EdgeStyle -> Yellow, VertexSize -> Small, VertexStyle -> Yellow]
You can use the following to get a list of all plays:
Partition[Normal[byplay[[1 ;;, 1, 2]]][[All, 2]], 4] // TableForm

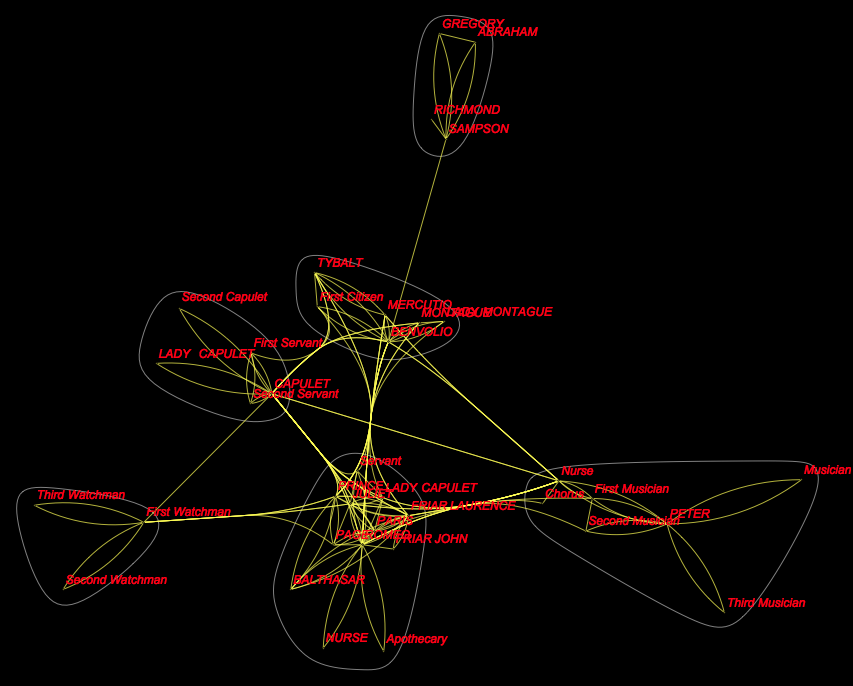
We can also use the very handy CommunityGraphPlot feature to look for groups of people in Romeo and Juliet:
g3 = CommunityGraphPlot[
  DeleteDuplicates@(Rule @@@ Partition[byplay[[28, All, 5]] //. {a___, x_, y_, b___} /; x == y -> {a, x, b}, 2, 1]), VertexLabels -> "Name",
  VertexLabelStyle -> Directive[Red, Italic, 12], Background -> Black,EdgeStyle -> Yellow, VertexSize -> Small, VertexStyle -> Yellow]
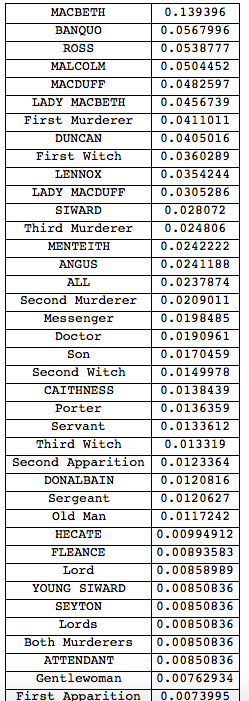
Oh, yes, and once we have the graphs we can use PageRank to figure out who the central characters are (for Macbeth):
Grid[Reverse@SortBy[Transpose[{VertexList[g], PageRankCentrality[g]}], Last], Frame -> All]
and here the same for Romeo and Juliet:
Grid[Reverse@SortBy[Transpose[{VertexList[g2], PageRankCentrality[g2]}], Last], Frame -> All]

Now I wanted to do something a bit more sophisticated, but the file I downloaded wasn't too good for that. I therefore downloaded the collection of all works of Shakespeare from the Gutenberg project:
shakespeare = Import["http://www.gutenberg.org/cache/epub/100/pg100.txt"];
It contains the following titles:
titles = (StringSplit[#, "\n"] & /@
     StringTake[StringSplit[shakespeare, "by William Shakespeare"][[1 ;;]], -45])[[;; -3, -1]];
TableForm[titles]
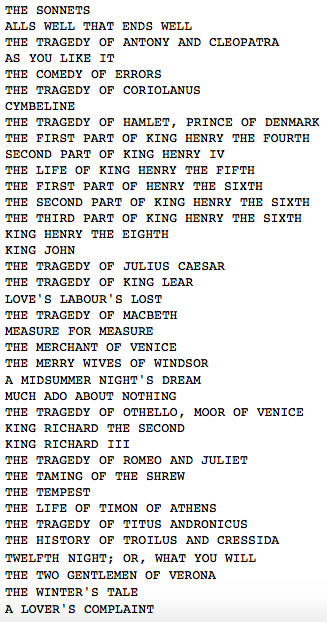
It is all one long string, so we might want to split it into the different plays etc:
textssplit = (StringSplit[shakespeare, "by William Shakespeare"][[2 ;; -2]]);
I'll next delete a copyright comment and make a list of names of the plays and the corresponding texts.
alltexts =
  Table[{titles[[i]],
    StringDelete[textssplit[[i]],
     "<<THIS ELECTRONIC VERSION OF THE COMPLETE WORKS OF WILLIAM
     SHAKESPEARE IS COPYRIGHT 1990-1993 BY WORLD LIBRARY, INC., AND
     IS PROVIDED BY PROJECT GUTENBERG ETEXT OF ILLINOIS BENEDICTINE COLLEGE
     WITH PERMISSION.  ELECTRONIC AND MACHINE READABLE COPIES MAY BE
     DISTRIBUTED SO LONG AS SUCH COPIES (1) ARE FOR YOUR OR OTHERS
     PERSONAL USE ONLY, AND (2) ARE NOT DISTRIBUTED OR USED
     COMMERCIALLY.  PROHIBITED COMMERCIAL DISTRIBUTION INCLUDES BY ANY
     SERVICE THAT CHARGES FOR DOWNLOAD TIME OR FOR MEMBERSHIP.>>"]}, {i, 1, Length[titles]}];
Ok. Now we have something to work with. here is a primitive sentiment analysis, similar to the one we used for the GOP presidential debates.
sentiments =
  Table[{titles[[i]], -"Negative" + "Positive" /. ((Classify["Sentiment", #, "Probabilities"] & /@ #) &@
       Select[TextSentences[alltexts[[i, 2]]], Length[TextWords[#]] > 1 &])}, {i, 1, Length[titles]}];
So we use a bit of machine learning and use the certainty of the algorithm to obtain estimates of sentiments. We should also average over a couple of consecutive sentences which is why we use MovingAverage
MovingAverage[sentiments[[4, 2]], 30] // ListLinePlot
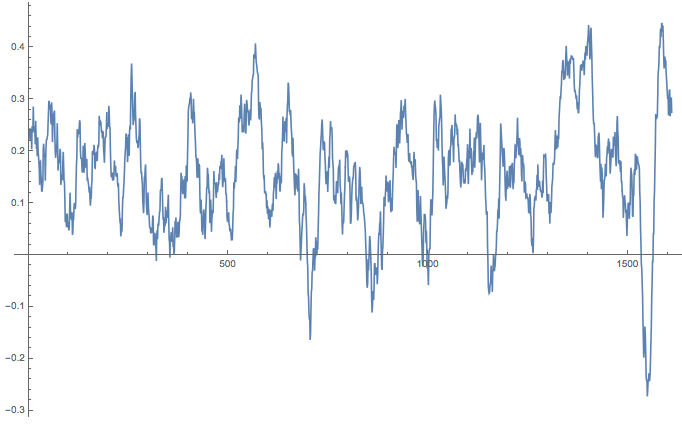
Ok. Let's normalise that to a standard length 1 (i.e. position in text in percent) and make it a bit more appealing:
ArrayReshape[
  ListLinePlot[
     Transpose@{Range[Length[#[[2]]]]/Length[#[[2]]], #[[2]]},
     PlotLabel -> #[[1]], Filling -> Axis, ImageSize -> Medium,
     Epilog -> {Red,
       Line[{{0, Mean[#[[2]]]}, {1, Mean[#[[2]]]}}]}] & /@
   Transpose@{titles,
     MovingAverage[#, 50] & /@ sentiments[[All, 2]]}, {19,
   2}] // TableForm

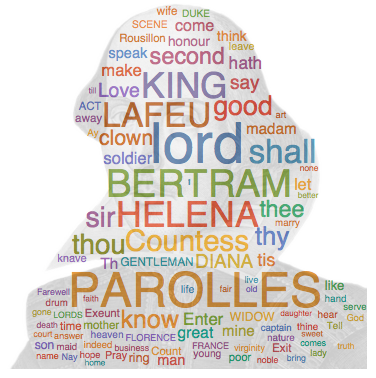
Let's make a couple of WordClouds for the individual plays. First I want an image of Shakespeare:
img = Import[
  "http://i0.wp.com/whatson.london/images/2013/07/Shakespeare.png?w=590"]; mask = Binarize[img, 0.0001];
We can then calculate a WordCloud in the shape of Shakespeare and overlay that to the image of the genius:
cloud = Image[WordCloud[DeleteStopwords[TextWords[alltexts[[2, 2]]]], mask, IgnoreCase -> True]];
ImageCompose[cloud, {ImageResize[img, ImageDimensions[cloud]], 0.2}]
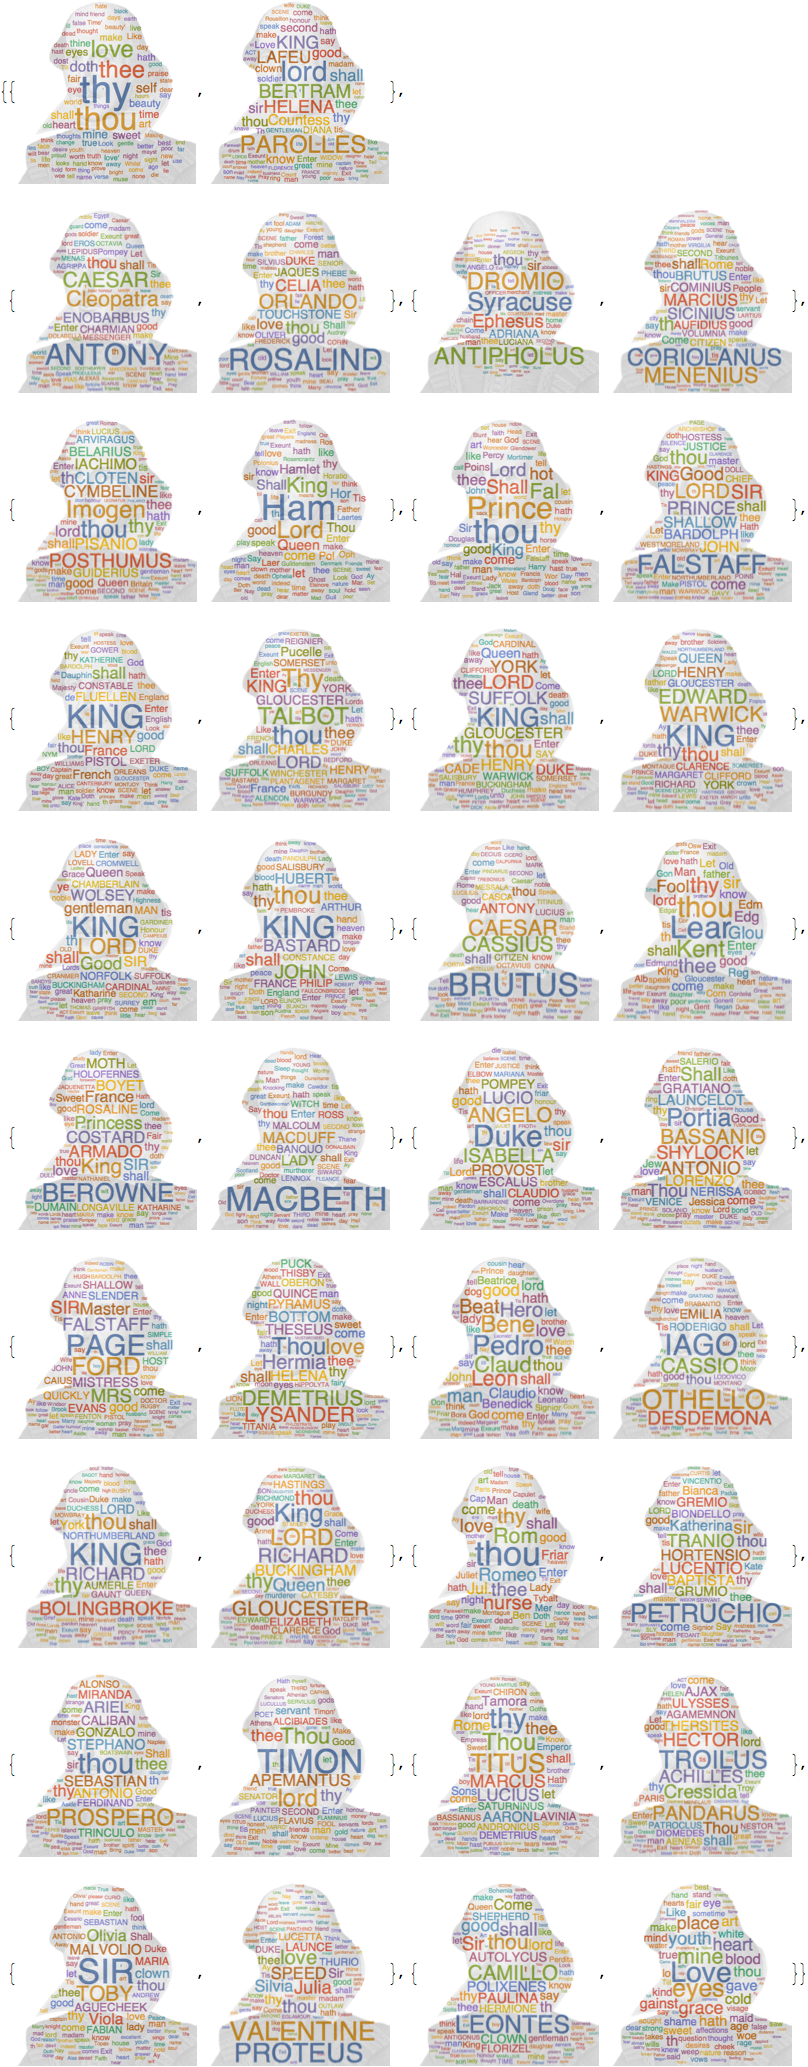
Ok. Let's do that for all texts:
Monitor[wordclouds =
   Table[{alltexts[[k, 1]],
     cloud = Image[WordCloud[DeleteStopwords[TextWords[alltexts[[k, 2]]]], mask, IgnoreCase -> True]];
     ImageCompose[cloud, {ImageResize[img, ImageDimensions[cloud]], 0.2}]}, {k, 1,Length[titles]}];, k]
and plot it:
ArrayReshape[wordclouds[[All, 2]], {19, 2}] // TableForm
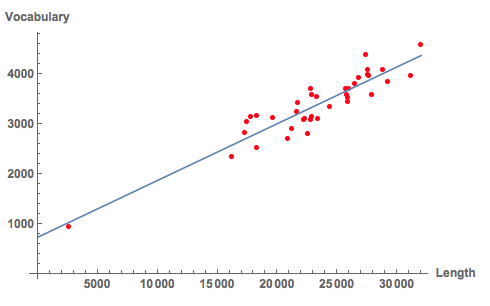
We can now also count the words per text and see how many different words Shakespeare uses:
textlength = Transpose[{alltexts[[All, 1]], Length[TextWords[#]] & /@ alltexts[[All, 2]]}];
textvocabulary = Transpose[{alltexts[[All, 1]], Length[DeleteDuplicates[ToLowerCase[DeleteStopwords[TextWords[#]]]]] & /@ alltexts[[All, 2]]}];
Here is a representation of that:
Show[
ListPlot[Table[Tooltip[{textlength[[k, 2]], textvocabulary[[k, 2]]}, textlength[[k, 1]]], {k, 1, Length[textlength]}],
PlotStyle -> Directive[Red], AxesLabel -> {"Length", "Vocabulary"}, LabelStyle -> Directive[Bold, Medium]],
Plot[Evaluate@Normal[LinearModelFit[Transpose[{textlength[[All, 1]], textlength[[All, 2]], textvocabulary[[All, 2]]}][[All, {2, 3}]], x, x]], {x, 0,32000}]]
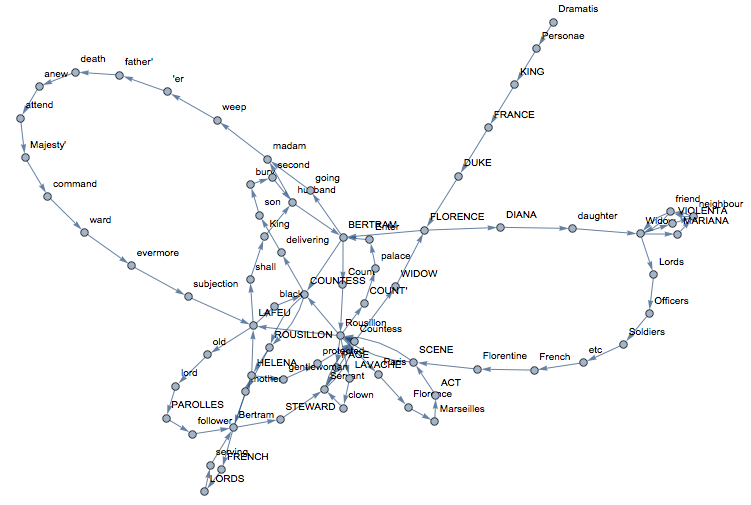
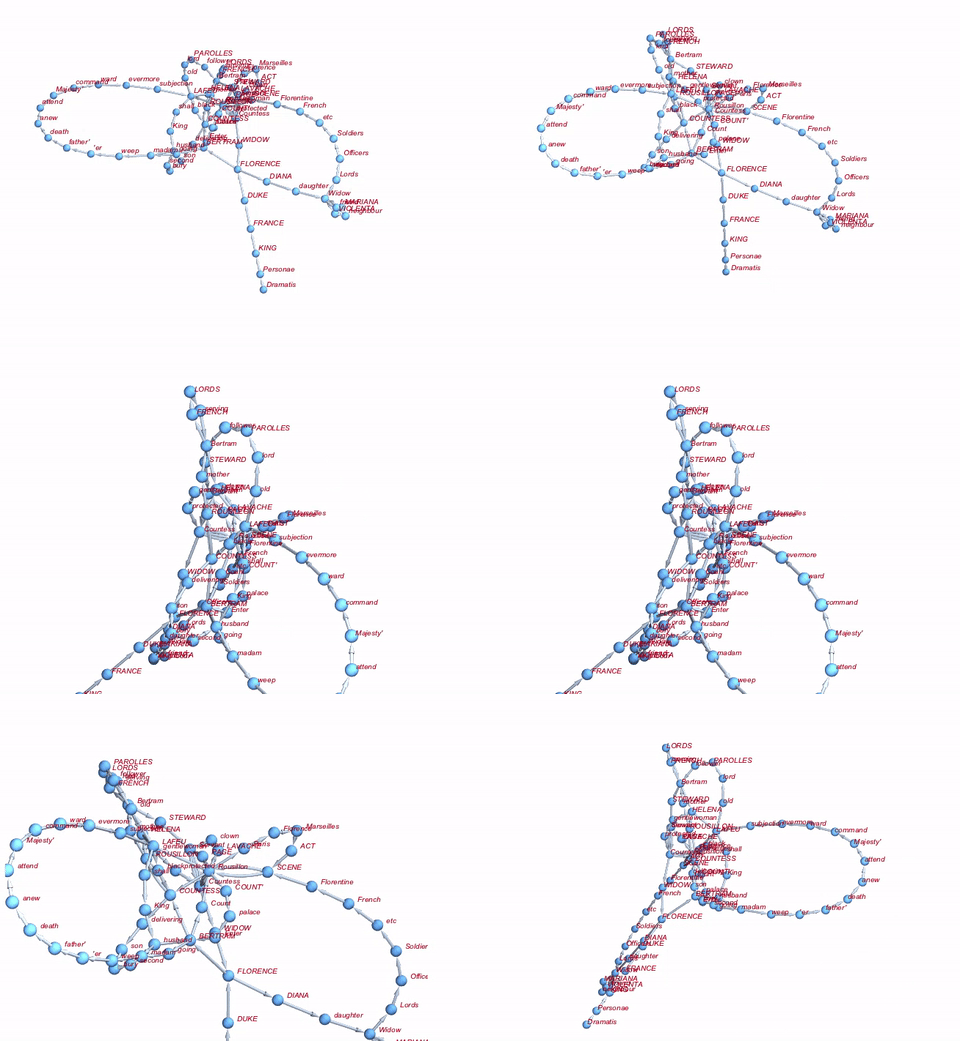
We can also construct something which is like a semantic network. Basically, we delete all Stopwords and build a network of the sequences of remaining words:
Graph[Rule @@@ Partition[DeleteStopwords[TextWords[alltexts[[2, 2]]]], 2, 1][[1 ;; 100]], VertexLabels -> "Name"]
If we want to be really fancy about it, we can do the whole thing in 3D:
Graph3D[Rule @@@ Partition[DeleteStopwords[TextWords[alltexts[[2, 2]]]], 2, 1][[1 ;; 100]], ImageSize -> Large, VertexLabels -> "Name", VertexLabelStyle -> Directive[Red, Italic, 10]]
Well, that's not a lot, but perhaps a starting point.
Cheers,
M.