Message Boards Message Boards

Knitting images

Dear all, inspired by another great post of @Anton Antonov and in particular there by a remark of @Vitaliy Kaurov pointing to the art of knitting images I could not resist trying with Mathematica. Clearly - this problem is crying out loudly for Radon transform!

enter image description here

I start by choosing some example image, convert it to inverse grayscale and perform the Radon transform.

ClearAll["Global`*"]
img0 = RemoveBackground[
   ImageTrim[
    ExampleData[{"TestImage", "Girl3"}], {{80, 30}, {250, 240}}], {"Background", {"Uniform", .29}}];
img1 = ImageAdjust[ColorNegate@ColorConvert[RemoveAlphaChannel[img0], "Grayscale"]];
{xDim, yDim} = {180, 400}; (* i.e. angles between 1\[Degree] and 180\[Degree] *)

rd0 = Radon[img1, {xDim, yDim}];
ImageCollage[{img0, ImageAdjust@rd0}, Method -> "Rows", 
 Background -> None, ImagePadding -> 10]

enter image description here

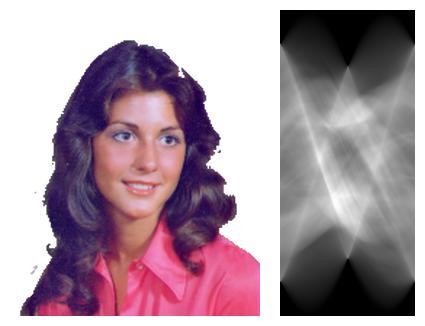
Every column of the Radon image represents a different angle of projection. So next I separate these columns into (here 180) single Radon images and do an inverse Radon transform on each:

maskLine[a_] := Table[If[a == n, 1, 0], {n, 1, xDim}];
maskImg = Table[Image[ConstantArray[maskLine[c], yDim]], {c, 1, xDim}];
rdImgs = rd0 maskImg;
ProgressIndicator[Dynamic[n], {1, xDim}]
invRadImgs = 
  Table[{ImageApply[If[# > 0, #, 0] &, 
     InverseRadon[rdImgs[[n]]]], -(n - 91) \[Degree]}, {n, 1, xDim}];

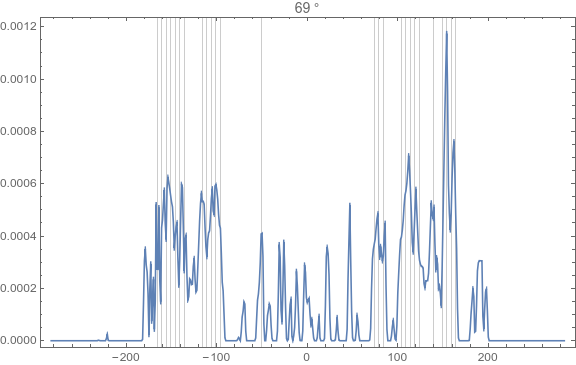
These data already represent the angle dependent intensities for backpropagation. Now one just has somehow to translate these intensities into discretely spaced lines (because this is the actual task in analogy to the above mentioned knitting ). Here is my simple attempt, which e.g. for 69° gives the following result (I am not really happy with this - there is definitely room for improvement!):

enter image description here

valsAngle[invRads_] := Module[{img, angle, data, l2},
   angle = Last@invRads;
   data = Max /@ (Transpose@*ImageData@*ImageRotate @@ invRads);
   l2 = Round[Length[data]/2];
   data = MapIndexed[{First[#2] - l2, #1} &, data];
   {Select[
     Times @@@ ({#1, 
          If[#2 > .0003, 1, 0]} & @@@ ((Mean /@ # &)@*Transpose /@ 
          Partition[data, 5])), # != 0 &], angle}  (* 
   limiting value of 0.0003 is just empirical! *)
   ];

va = valsAngle /@ invRadImgs;
graphicsData[va_] := Module[{u, angle},
   {u, angle} = va;
   InfiniteLine[# {Cos[angle], -Sin[angle]}, {Sin[angle], 
       Cos[angle]}] & /@ u];

gd = graphicsData /@ va;
Graphics[{Thickness[.0003], gd}, ImageSize -> 600, 
 PlotRange -> {{-170, 170}, {-220, 220}}]

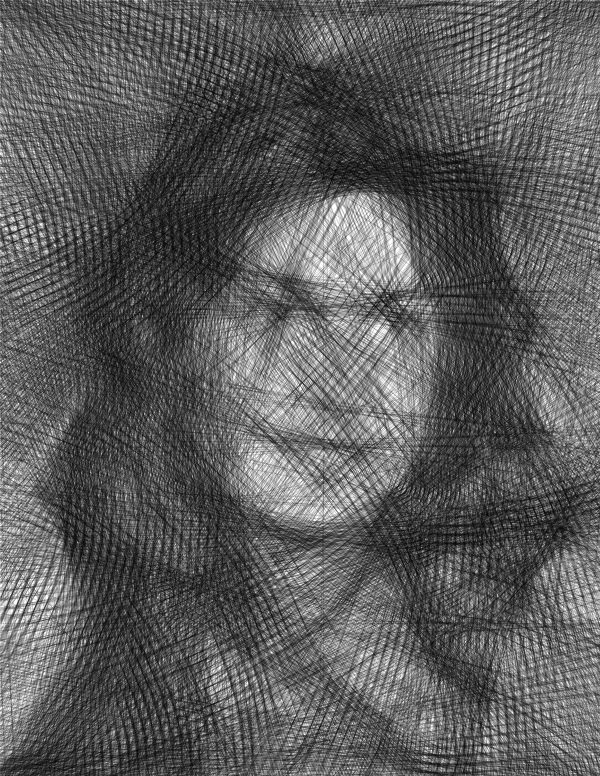
... and the result is a bunch of lines:

enter image description here

POSTED BY: Henrik Schachner
19 Replies

Dear Daniel, dear Vitaliy,

OK, persuaded! I will do my very best ...

Kind regards -- Henrik

POSTED BY: Henrik Schachner

Dear Henrik Schachner,

Very nice (he said belatedly). Please consider submitting a version of this to the Wolfram Function Repository.

POSTED BY: Daniel Lichtblau
Posted 5 years ago

Can you use this code in the online version of Wolfram?

POSTED BY: Gaha Melas

enter image description here

One more! :)

POSTED BY: Arnoud Buzing

Fantastic - I am amazed anew!

POSTED BY: Henrik Schachner

This has a certain "Take On Me" feel to it :)

enter image description here

POSTED BY: Arnoud Buzing

The pleasure is all mine, to see how folks have a great time here figuring things out :-) I think this particular idea would make an excellent Wolfram Function Repository item:

https://resources.wolframcloud.com/FunctionRepository

What's great about it - immediate access from inside of Wolfram Language and also proper authorship attribution. I like that people can publish algorithms and refer to them as to journal articles. This is a relevant example by Simon Woods:

https://resources.wolframcloud.com/FunctionRepository/resources/XKCDConvert

Please consider this if you get a moment ;-)

POSTED BY: Vitaliy Kaurov

Thanks I liked the demo very much that I just had to try it in color, very related to CT back projection algorithms, but then enhancing streaking artifacts rather than reducing them.

POSTED BY: Martijn Froeling

Thank you, Vitaliy! It always pays to follow your suggestions. And it is very interesting for me to see how others continue and push this idea much further.

Best regards -- Henrik

POSTED BY: Henrik Schachner

Martijn, this is great. I tried that (working on each color channel separately) yesterday night, but this alone does not work, because the lines superimpose each other.

I change the algorithm a bit such that the lines have the opacity of the amplitude of the peaks.

This actually does the trick - terrific idea, thanks for sharing!

Best regards -- Henrik

POSTED BY: Henrik Schachner

Henrik, this is spectacular! Thank you for following up on those links I posted, this is an amazing solution! So I think projecting the line equations onto a circle will get as the locations for pins if we are to recreate this in a physical model. Wonderful !

POSTED BY: Vitaliy Kaurov

In color is also possible, split the image in the RGB channels, convert to lines for each and compose to a color image. enter image description here
enter image description here

I change the algorithm a bit such that the lines have the opacity of the amplitude of the peaks. enter image description here

Results of the black and white and color. enter image description here

Attachments:
POSTED BY: Martijn Froeling

Hi Olivier,

Thanks for your excellent support. This is very much appreciated !

Best Regards, Mit freundlichen Grüßen, ...... Jos

POSTED BY: Jos Klaps

Hi Jos, here is my part of the animation code:

index = Round@Subdivide[1, Length[gd], 20];

gifImgs = 
  Table[Graphics[{Thickness[.0003], gd[[;; n]], Thickness[.001], Red, 
     gd[[n]]}, ImageSize -> 600, Frame -> False, 
    PlotRange -> {{-170, 170}, {-220, 220}}], {n, index}];

AppendTo[gifImgs, 
  Graphics[{Thickness[.0003], gd}, ImageSize -> 600, Frame -> False, 
   PlotRange -> {{-170, 170}, {-220, 220}}]];

SetDirectory[NotebookDirectory[]]

Export["ImageOfLines0.gif", gifImgs, "DisplayDurations" -> 0.5]

Admittedly I did the fine tuning (i.e. the adjustment of the display duration at the beginning and at the end) with gimp.

POSTED BY: Henrik Schachner

Hi Olivier,

Very very nice! Thanks for sharing!

I would like to make an animation with Export []of this, but without success. How did you make this, Can you help me?

Thanks in advance !

Best Regards, Gruß, ...... Jos

POSTED BY: Jos Klaps

Hi Oliver, nice picture! You are right: How uninspired using just black lines! Regards -- Henrik

POSTED BY: Henrik Schachner
Posted 5 years ago

Very well done (like all your posts:) .

Here is just another portrait in blue generated with your code.

enter image description here

POSTED BY: Oliver Seipel

Hi Sander, thanks for your kind words! Color! - well, my background is radiology, and there the world is black and white. But it is a really neat idea! My first guess is to apply the above procedure to each color channel.

POSTED BY: Henrik Schachner

Very very neat! Thanks for sharing!

Can color be added, or is that less-than-trivial?

POSTED BY: Sander Huisman
Reply to this discussion
Community posts can be styled and formatted using the Markdown syntax.
Reply Preview
Attachments
Remove
or Discard

Group Abstract Group Abstract