The epidemiological models are useful for understanding different levels of dynamics, but it is hard to get all the rates right until the epidemic is over. Since coronavirus is assumed to be new to the human race, almost everybody should be susceptible. And since there is no treatment nor vaccination, then quarantine becomes the only effective method of control. The logistic model only requires that at some point quarantine becomes effective. At the outset, the infection can spread exponentially because almost everybody is susceptible, the exponential phase can go to complete diffusion because of easy international travel so a few hundreds of infected people can seed most of the world. Thus the only way to break the spread is effective quarantine. And the spread of quarantine methodology has to be faster than the spread of the infection. So with coronavirus now that there is effective testing to enhance quarantine, the quarantine method should halt the spread. Looking at the logistic model, early on in the epidemic there is little evidence that quarantine is working, until it fully kicks in, then control should be rapid.
This is a graph I am finding useful.
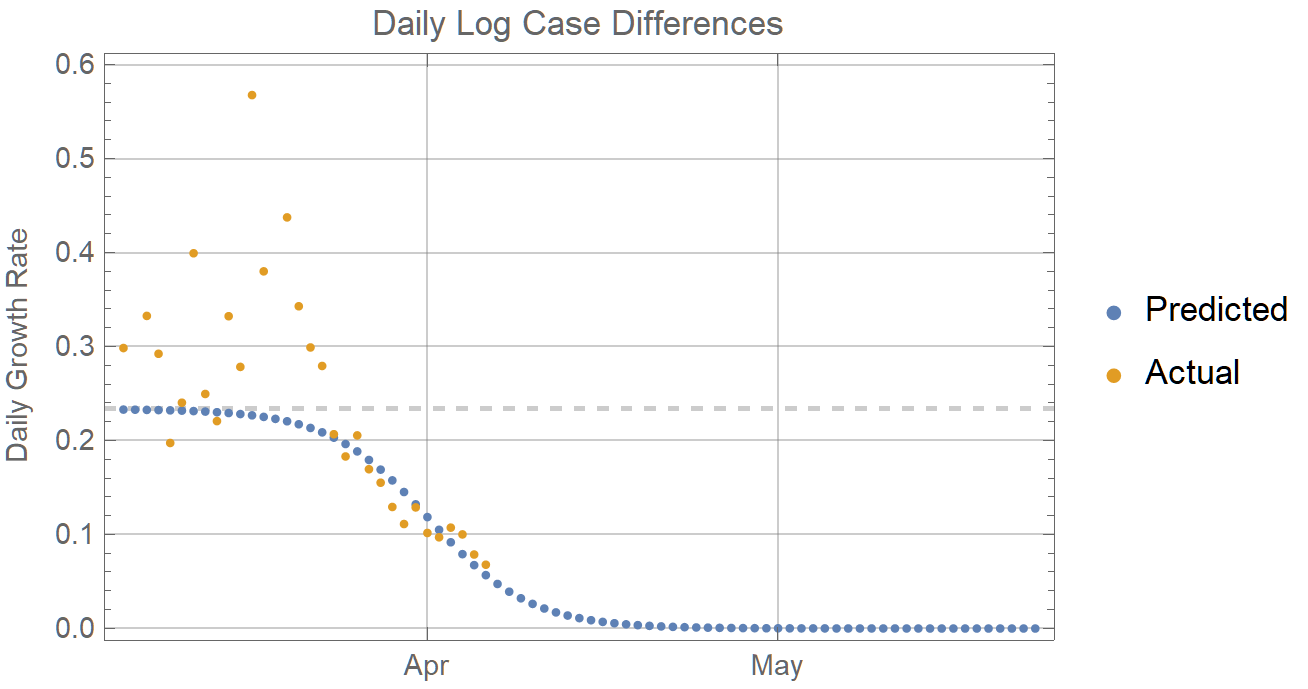 It is for the state of New York. The orange dots are the differences of the logarithms of the daily total cases. Thus it is a continuous growth rate. If growth were exponential it would be a horizontal line. And at the outset there is no pattern to the daily rates--they could be fit to any model, The blue dots are the course of daily rates predicted by the logistic model using all the orange dots for the fit. There is apparent convergence to the logistic model as the epidemic progresses. The default fitting method using Norm also favors the more recent points. This is a log plot of the cumulative cases in orange fit to the logistic model in blue. Since the squares of the later much higher values dominate, the early data are effectively ignored.
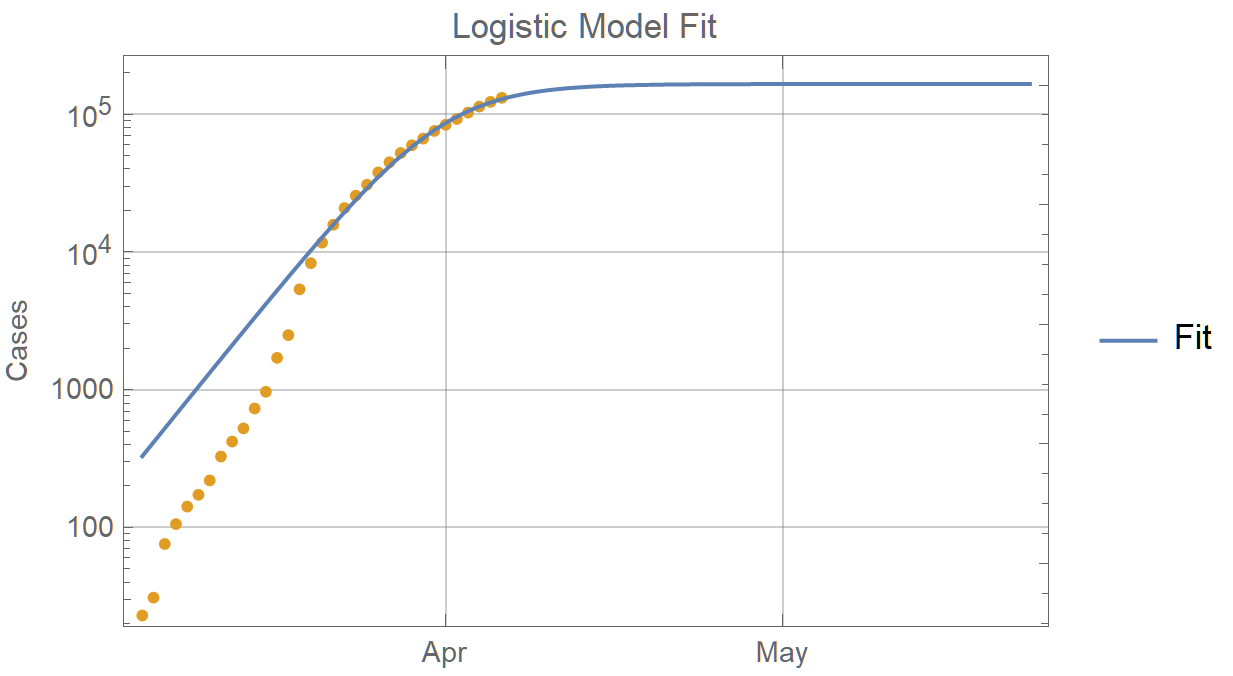
But in this case ignoring the early data is a good thing because early on there was not adequate testing and only the most obvious cases could be discovered. Since the counts are cumulative, cases which are eventually found end up in the cumulative totals, and it only takes three points with accurate information to fit the curve.
Since the quarantine effect can easily dominate, by spread of information almost instantly, quarantine could potentially break the epidemic in a maximum incubation period. For instance if a distance of six feet between each person for two weeks maximum incubation would break the transmission, then the epidemic could end in two weeks if everybody actually complied, and there were no people with carrier states.
I think the solution to the epidemiological modeling is to use the logistic model which only assumes quarantine first. Once the logistic model kicks in, it should give an accurate prediction of the susceptible population, as its limiting population, L. The rate parameter, k, is at the dashed line in the first graph, and this is likely a good estimate of the maximum exponential rate of spread for the virus. See Logistic Model for Quarantine Controlled Epidemics


