Dear @Hee-Young,
Not sure about (1), but I passed your post to our team. It’s an interesting question. I do know that people have been tested in areas with no confirmed cases. Finding out more about that could give an interesting look at the effectiveness of containment/prevention in those areas.
For (2), the source data gives the region information, which is actually the mixture of AdministrativeDivision, City, County as well as Air force base location. In the latest Wolfram Data Repository (WDR) item, we have the AdministrativeDivision column as well as more specific location (which gives the city or country information). So far most of the cities are for the US but I see some Canadian cities as well so it looks like there is possibility that more city information (outside the US) will be added in the future. Also note that the dataset has GeoPosition column, which gives more details and was used to create this additional example with geo bubbles (details at WDR):
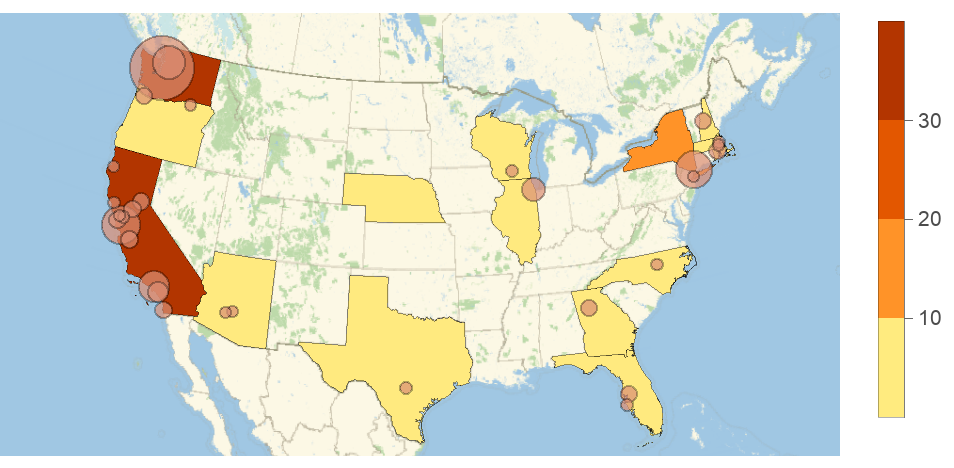
Show[GeoRegionValuePlot[
  Normal@ResourceData["Epidemic Data for Novel Coronavirus COVID-19"][
     Select[MatchQ[Entity["Country", "UnitedStates"], #Country] &]][
    GroupBy["AdministrativeDivision"], Total, #ConfirmedCases["LastValue"] &]], GeoBubbleChart[
  Normal@ResourceData["Epidemic Data for Novel Coronavirus COVID-19"][
     Select[MatchQ[Entity["Country", "UnitedStates"], #Country] && ! MissingQ[#AdministrativeDivision] &]][
    All, {#GeoPosition, #ConfirmedCases["LastValue"]} &], ChartStyle -> ColorData[8, 3]]]


